Sears 2008 Annual Report Download - page 76
Download and view the complete annual report
Please find page 76 of the 2008 Sears annual report below. You can navigate through the pages in the report by either clicking on the pages listed below, or by using the keyword search tool below to find specific information within the annual report.-
 1
1 -
2
-
3
-
4
-
5
-
6
-
7
-
8
-
9
-
10
-
11
-
12
-
13
-
14
-
15
-
16
-
17
-
18
-
19
-
20
-
21
-
22
-
23
-
24
-
25
-
26
-
27
-
28
-
29
-
30
-
31
-
32
-
33
-
34
-
35
-
36
-
37
-
38
-
39
-
40
-
41
-
42
-
43
-
44
-
45
-
46
-
47
-
48
-
49
-
50
-
51
-
52
-
53
-
54
-
55
-
56
-
57
-
58
-
59
-
60
-
61
-
62
-
63
-
64
-
65
-
 66
66 -
 67
67 -
 68
68 -
 69
69 -
 70
70 -
 71
71 -
 72
72 -
 73
73 -
 74
74 -
 75
75 -
 76
76 -
 77
77 -
 78
78 -
 79
79 -
 80
80 -
 81
81 -
 82
82 -
 83
83 -
 84
84 -
 85
85 -
 86
86 -
87
-
88
-
89
-
90
-
91
-
92
-
93
-
94
-
95
-
96
-
97
-
98
-
99
-
100
-
101
-
102
-
103
 |
 |

SEARS HOLDINGS CORPORATION
Notes to Consolidated Financial Statements—(Continued)
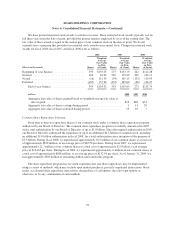
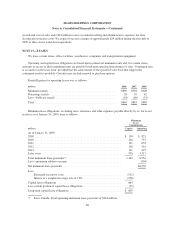
For 2009 and beyond, the domestic weighted-average health care cost trend rates used in measuring the
postretirement benefit expense are an 8.3% trend rate in 2009 to an ultimate trend rate of 8.0% in 2013. A
one-percentage-point change in the assumed health care cost trend rate would have the following effects on the
postretirement liability:
millions
1 percentage-point
Increase
1 percentage-point
Decrease
Effect on total service and interest cost
components ................................ $ 1 $ (1)
Effect on postretirement benefit obligation ......... $14 $(13)
$64 million of the unrecognized net gains in accumulated other comprehensive income are expected to be
amortized as a component of net periodic benefit cost during fiscal 2009.
Information regarding expected future cash flows for our benefit plans is as follows:
millions
SHC
Domestic
Sears
Canada Total
Pension benefits:
Employer contributions:
Fiscal 2009 (expected) ......................................... $ 171 $ 5 $ 176
Expected benefit payments:
Fiscal 2009 ...................................................... $ 332 $ 86 $ 418
Fiscal 2010 ...................................................... 337 88 425
Fiscal 2011 ...................................................... 344 90 434
Fiscal 2012 ...................................................... 377 92 469
Fiscal 2013 ...................................................... 383 95 478
Fiscal 2014-2018 .................................................. 2,003 497 2,500
Postretirement benefits:
Employer contributions:
Fiscal 2009 (expected) ......................................... $ 39 $ 12 $ 51
Expected benefit payments:
Fiscal 2009 ...................................................... $ 39 $ 15 $ 54
Fiscal 2010 ...................................................... 37 16 53
Fiscal 2011 ...................................................... 35 16 51
Fiscal 2012 ...................................................... 33 17 50
Fiscal 2013 ...................................................... 31 17 48
Fiscal 2014-2018 .................................................. 129 88 217
76