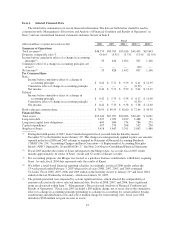
Sears 2008 Annual Report Download - page 28
Download and view the complete annual report
Please find page 28 of the 2008 Sears annual report below. You can navigate through the pages in the report by either clicking on the pages listed below, or by using the keyword search tool below to find specific information within the annual report.-
 1
1 -
2
-
3
-
4
-
5
-
6
-
7
-
8
-
9
-
10
-
11
-
12
-
13
-
14
-
15
-
16
-
17
-
 18
18 -
 19
19 -
 20
20 -
 21
21 -
 22
22 -
 23
23 -
 24
24 -
 25
25 -
 26
26 -
 27
27 -
 28
28 -
 29
29 -
 30
30 -
 31
31 -
 32
32 -
 33
33 -
 34
34 -
 35
35 -
 36
36 -
 37
37 -
 38
38 -
39
-
40
-
41
-
42
-
43
-
44
-
45
-
46
-
47
-
48
-
49
-
50
-
51
-
52
-
53
-
54
-
55
-
56
-
57
-
58
-
59
-
60
-
61
-
62
-
63
-
64
-
65
-
66
-
67
-
68
-
69
-
70
-
71
-
72
-
73
-
74
-
75
-
76
-
77
-
78
-
79
-
80
-
81
-
82
-
83
-
84
-
85
-
86
-
87
-
88
-
89
-
90
-
91
-
92
-
93
-
94
-
95
-
96
-
97
-
98
-
99
-
100
-
101
-
102
-
103
 |
 |
expense rate increased, primarily reflecting lower expense leverage resulting from lower overall sales levels. The
reduction in payroll and benefits expense was offset by increases in a number of other categories, most notably in
selling and administrative expenses at Canada, which include an increase of $83 million related to the impact of
currency exchange rates.
The selling and administrative expense rate was 22.6% in fiscal 2007, as compared to 21.8% for fiscal 2006.
While total selling and administrative expenses declined $106 million in fiscal 2007, the current year selling and
administrative rate increased, primarily reflecting lower expense leverage resulting from lower overall sales
levels.
Depreciation and Amortization
Depreciation and amortization expense was $1.0 billion for fiscal 2007, as compared to $1.1 billion for
fiscal 2006. The decreased expense for fiscal 2007 is primarily attributable to additional property and equipment
becoming fully depreciated during the year, thereby decreasing our depreciable asset base.
Gains on Sales of Assets
Gains on sales of assets were $38 million in fiscal 2007, as compared to $82 million for fiscal 2006. The
fiscal 2006 gain was primarily attributable to a $41 million pre-tax gain recognized in connection with the 2005
sale of our former Kmart headquarters in Troy, Michigan.
Restructuring Charges
Restructuring charges were $28 million for fiscal 2006. These charges included $19 million for
employee-related termination costs associated with Sears Canada’s restructuring initiatives implemented during
fiscal 2005, including a workforce reduction of approximately 1,200 associates, as well as $9 million at Kmart
for relocation assistance and employee termination-related costs associated with Holdings’ home office
integration efforts. We did not incur any restructuring costs during fiscal 2007.
Interest and Investment Income
Interest and investment income was $135 million in fiscal 2007, as compared with $253 million in fiscal
2006. As discussed above, the decreased interest and investment income in fiscal 2007 was primarily due to
performance of investments in total return swaps (losses of $14 million recognized in the current year as
compared to total return swap income of $74 million recognized in fiscal 2006) and less interest earned on our
cash balances, partially offset by a $20 million dividend received from our investment in Sears Mexico.
Interest Expense
We incurred $286 million in interest expense during fiscal 2007, as compared to $335 million in 2006. The
reduction in interest expense is attributable to lower average outstanding borrowings during fiscal 2007.
Other Income
Other income is primarily comprised of bankruptcy-related recoveries in the amount of $18 million and $14
million for fiscal 2007 and 2006, respectively. Bankruptcy-related recoveries increased $4 million in fiscal 2007
and represent amounts recovered from vendors who had received cash payment for pre-petition obligations. See
Note 10 of Notes to Consolidated Financial Statements for further detail. Other income in fiscal 2006 also
included income recorded relative to foreign currency forward contracts for which hedge accounting was not
applied. See Note 5 of Notes to Consolidated Financial Statements for further details.
28