Sears 2008 Annual Report Download - page 69
Download and view the complete annual report
Please find page 69 of the 2008 Sears annual report below. You can navigate through the pages in the report by either clicking on the pages listed below, or by using the keyword search tool below to find specific information within the annual report.-
 1
1 -
2
-
3
-
4
-
5
-
6
-
7
-
8
-
9
-
10
-
11
-
12
-
13
-
14
-
15
-
16
-
17
-
18
-
19
-
20
-
21
-
22
-
23
-
24
-
25
-
26
-
27
-
28
-
29
-
30
-
31
-
32
-
33
-
34
-
35
-
36
-
37
-
38
-
39
-
40
-
41
-
42
-
43
-
44
-
45
-
46
-
47
-
48
-
49
-
50
-
51
-
52
-
53
-
54
-
55
-
56
-
57
-
58
-
 59
59 -
 60
60 -
 61
61 -
 62
62 -
 63
63 -
 64
64 -
 65
65 -
 66
66 -
 67
67 -
 68
68 -
 69
69 -
 70
70 -
 71
71 -
 72
72 -
 73
73 -
 74
74 -
 75
75 -
 76
76 -
 77
77 -
 78
78 -
 79
79 -
80
-
81
-
82
-
83
-
84
-
85
-
86
-
87
-
88
-
89
-
90
-
91
-
92
-
93
-
94
-
95
-
96
-
97
-
98
-
99
-
100
-
101
-
102
-
103
 |
 |

SEARS HOLDINGS CORPORATION
Notes to Consolidated Financial Statements—(Continued)
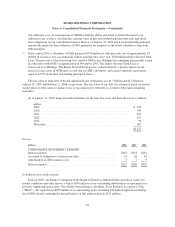
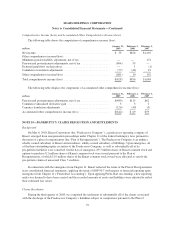
The following table provides the fair value measurement amounts for assets and liabilities recorded on our
consolidated balance sheet at fair value as of January 31, 2009:
millions
Total Fair
Value
Amounts at
January 31,
2009 Level 1 Level 2 Level 3
Short-term investments(1) ........................................ $ 38 $— $ 38 $—
Foreign currency derivative assets(2) ............................... 74 — 74 —
Foreign currency derivative liabilities(3) ............................ (6) — (6) —
Total .................................................... $106 $— $106 $—
(1) Included within Prepaid expenses and other current assets on the consolidated balance sheet.
(2) Included within Accounts receivable on the consolidated balance sheet.
(3) Included within Other current liabilities on the consolidated balance sheet.
Short-term investments are typically valued at the closing price in the principal active market as of the last
business day of the year. Short-term investments at January 31, 2009 include $38 million on deposit with The
Reserve Primary Fund, a money market fund which has temporarily suspended withdrawals while it liquidates its
holdings to generate cash to distribute. The fair value of this investment was determined by using estimates based
on the values of similar assets and information obtained from the brokerage through which trades are made. On
February 20, 2009, after the end of fiscal 2008, we received a distribution of $13 million of the total $38 million
that had been held on deposit with The Reserve Primary Fund at January 31, 2009. We recorded a $3 million loss
in connection with our investment in The Reserve Primary Fund for the fiscal year ended January 31, 2009.
The fair values of derivative assets and liabilities traded in the over-the-counter market are determined using
quantitative models that require the use of multiple inputs including interest rates, prices and indices to generate
pricing and volatility factors. The predominance of market inputs are actively quoted and can be validated
through external sources, including brokers, market transactions and third-party pricing services. Our derivative
instruments are valued using Level 2 measurements.
In February 2007, the FASB issued SFAS No. 159, “The Fair Value Option for Financial Assets and
Financial Liabilities—including an amendment of FASB Statement No. 115,” which permits entities to elect to
measure many financial instruments and certain other items at fair value. For Holdings, SFAS No. 159 was
effective as of February 3, 2008 and had no impact on amounts presented for periods prior to the effective date.
We do not currently have any financial assets or financial liabilities for which the provisions of SFAS No. 159
have been elected. However, in the future, we may elect to measure certain financial instruments at fair value in
accordance with this standard.
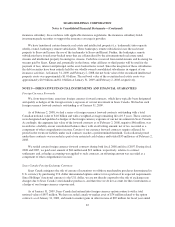
Financial Guarantees
We issue various types of guarantees in the normal course of business. We had the following guarantees
outstanding as of January 31, 2009:
millions
Bank
Issued
SRAC
Issued Other Total
Standby letters of credit ............................................. $976 $119 $— $1,095
Commercial letters of credit .......................................... 79 98 — 177
Secondary lease obligations .......................................... — — 18 18
69