Sears 2008 Annual Report Download - page 32
Download and view the complete annual report
Please find page 32 of the 2008 Sears annual report below. You can navigate through the pages in the report by either clicking on the pages listed below, or by using the keyword search tool below to find specific information within the annual report.-
 1
1 -
2
-
3
-
4
-
5
-
6
-
7
-
8
-
9
-
10
-
11
-
12
-
13
-
14
-
15
-
16
-
17
-
18
-
19
-
20
-
21
-
 22
22 -
 23
23 -
 24
24 -
 25
25 -
 26
26 -
 27
27 -
 28
28 -
 29
29 -
 30
30 -
 31
31 -
 32
32 -
 33
33 -
 34
34 -
 35
35 -
 36
36 -
 37
37 -
 38
38 -
 39
39 -
 40
40 -
 41
41 -
 42
42 -
43
-
44
-
45
-
46
-
47
-
48
-
49
-
50
-
51
-
52
-
53
-
54
-
55
-
56
-
57
-
58
-
59
-
60
-
61
-
62
-
63
-
64
-
65
-
66
-
67
-
68
-
69
-
70
-
71
-
72
-
73
-
74
-
75
-
76
-
77
-
78
-
79
-
80
-
81
-
82
-
83
-
84
-
85
-
86
-
87
-
88
-
89
-
90
-
91
-
92
-
93
-
94
-
95
-
96
-
97
-
98
-
99
-
100
-
101
-
102
-
103
 |
 |

Sears Domestic
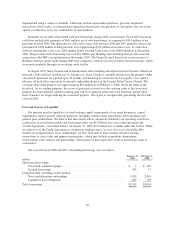
Sears Domestic results and key statistics were as follows:
millions, except for number of stores 2008 2007 2006
Merchandise sales and services ........................................ $25,315 $27,845 $29,179
Cost of sales, buying and occupancy .................................... 18,084 19,589 20,120
Gross margin dollars ................................................ 7,231 8,256 9,059
Gross margin rate .................................................. 28.6% 29.6% 31.0%
Selling and administrative ............................................ 6,415 6,698 6,820
Selling and administrative expense as a percentage of total revenues .......... 25.3% 24.1% 23.4%
Depreciation and amortization ......................................... 724 802 927
Impairment charges ................................................. 339 — —
Gain on sales of assets ............................................... (10) (28) (11)
Total costs and expenses ......................................... 25,552 27,061 27,856
Operating income (loss) .............................................. $ (237) $ 784 $ 1,323
Number of:
Full-line Stores(1) ............................................... 929 935 935
Specialty Stores ................................................ 1,233 1,150 1,095
Total Domestic Sears Stores .......................................... 2,162 2,085 2,030
(1) Fiscal 2008 includes 856 full-line stores and 73 Sears Essentials/Grand stores; Fiscal 2007 includes 860 full-
line stores and 75 Sears Essentials/Grand stores; Fiscal 2006 includes 861 full-line stores and 74 Sears
Essentials/Grand stores
Fiscal 2008 Compared to Fiscal 2007
Total Revenues and Comparable Store Sales
Merchandise sales and services revenues declined $2.5 billion, or 9.1%, to $25.3 billion for fiscal 2008, as
compared to total revenues of $27.8 billion for fiscal 2007. The decline was due primarily to an aggregate 9.5%
decrease in comparable store sales. Comparable store sales declines were driven by high single digit percentage
declines recorded in the home appliances and household goods categories and low double digit percentage
declines recorded in the apparel, tools and lawn and garden categories.
Gross Margin
For fiscal 2008, Sears Domestic generated $7.2 billion in total gross margin, as compared to $8.3 billion in
fiscal 2007, a decline of $1.1 billion. The decline includes a $21 million charge taken to markdown inventory in
connection with store closings and primarily reflects the negative margin impact of lower overall sales levels, as
well as a decline in Sears Domestic’s gross margin rate for the quarter. Sears Domestic’s gross margin rate was
28.6% in fiscal 2008, as compared to 29.6% in fiscal 2007, a decline of 100 basis points.
Reduced leverage of buying and occupancy costs, given lower overall sales levels, accounted for
approximately 10 basis points of the total decline, with the remaining 90 basis point decline attributable to gross
margin rate declines across a number of merchandise categories, most notably home appliances and apparel.
While we tightly managed inventory levels all year, with the goal of reducing inventory to below last year’s
levels, the economic environment resulted in increased markdowns, which is the primary reason for the
remaining 90 basis point decline in Sears Domestic’s gross margin rate. Gross margin rate decreases in the
apparel category are mainly the result of markdowns taken to clear seasonal merchandise. The decline in gross
margin rate for Sears Domestic was not as great during the fourth quarter of fiscal 2008 as purchases of seasonal
and winter apparel became more consistent with current sales trends.
32