Rosetta Stone 2010 Annual Report Download - page 99
Download and view the complete annual report
Please find page 99 of the 2010 Rosetta Stone annual report below. You can navigate through the pages in the report by either clicking on the pages listed below, or by using the keyword search tool below to find specific information within the annual report.-
 1
1 -
2
-
3
-
4
-
5
-
6
-
7
-
8
-
9
-
10
-
11
-
12
-
13
-
14
-
15
-
16
-
17
-
18
-
19
-
20
-
21
-
22
-
23
-
24
-
25
-
26
-
27
-
28
-
29
-
30
-
31
-
32
-
33
-
34
-
35
-
36
-
37
-
38
-
39
-
40
-
41
-
42
-
43
-
44
-
45
-
46
-
47
-
48
-
49
-
50
-
51
-
52
-
53
-
54
-
55
-
56
-
57
-
58
-
59
-
60
-
61
-
62
-
63
-
64
-
65
-
66
-
67
-
68
-
69
-
70
-
71
-
72
-
73
-
74
-
75
-
76
-
77
-
78
-
79
-
80
-
81
-
82
-
83
-
84
-
85
-
86
-
87
-
88
-
 89
89 -
 90
90 -
 91
91 -
 92
92 -
 93
93 -
 94
94 -
 95
95 -
 96
96 -
 97
97 -
 98
98 -
 99
99 -
 100
100 -
 101
101 -
 102
102 -
 103
103 -
 104
104 -
 105
105 -
 106
106 -
 107
107 -
 108
108 -
 109
109 -
110
-
111
-
112
-
113
-
114
-
115
-
116
-
117
-
118
-
119
-
120
-
121
-
122
-
123
-
124
-
125
-
126
-
127
-
128
-
129
-
130
-
131
-
132
-
133
-
134
-
135
-
136
-
137
-
138
-
139
-
140
-
141
-
142
-
143
-
144
-
145
-
146
-
147
-
148
-
149
-
150
-
151
-
152
-
153
 |
 |

Table of Contents
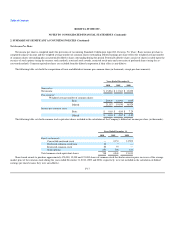
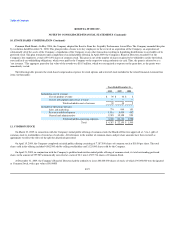
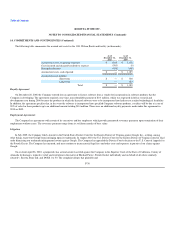
10. STOCK-BASED COMPENSATION (Continued)
forfeitures. Stock-based compensation expense recognized is based on the estimated portion of the awards that are expected to vest. Estimated forfeiture rates
were applied in the expense calculation. The fair value of each option grant is estimated on the date of grant using the Black Scholes option pricing model as
follows:
Year Ended December 31,
2010 2009 2008
Expected stock price volatility 58% - 66% 61% 57% - 62%
Expected term of options 6 years 6 years 6 years
Expected dividend yield — — —
Risk-free interest rate 1.14% - 2.59% 1.71% - 2.46% 2.08% - 3.36%
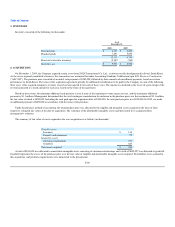
Prior to the completion of the Company's initial public offering in April 2009, the Company's stock was not publicly quoted and the Company had a
limited history of stock option activity, so the Company reviewed a group of comparable industry-related companies to estimate its expected volatility over
the most recent period commensurate with the estimated expected term of the awards. In addition to analyzing data from the peer group, the Company also
considered the contractual option term and vesting period when determining the expected option life and forfeiture rate. Subsequent to the initial public
offering, the Company continues to review a group of comparable industry-related companies to estimate volatility, but also reviews the volatility of its own
stock since the initial public offering. The Company considers the volatility of the comparable companies to be the best estimate of future volatility. For the
risk-free interest rate, the Company uses a U.S. Treasury Bond rate consistent with the estimated expected term of the option award.
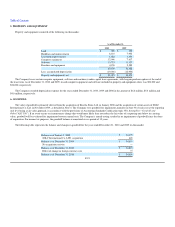
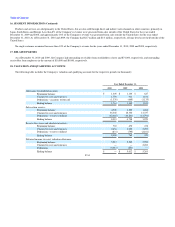
Stock Options—The following table summarizes the Company's stock option activity for the years ended December 31, 2010, 2009 and 2008:
Options
Outstanding
Weighted
Average
Exercise
Price
Weighted
Average
Contractual
Life (years)
Aggregate
Intrinsic
Value
Balance at January 1, 2010 1,976,229 9.14 7.58 17,511,103
Options granted 593,017 24.07
Options exercised (364,086) 6.57
Options cancelled (184,233) 17.20
Balance at December 31, 2010 2,020,927 13.25 7.36 17,733,080
Vested and expected to vest at December 31, 2009 1,878,917 8.73 7.5 17,396,124
Vested and expected to vest at December 31, 2010 1,874,974 12.58 7.23 17,530,810
As of December 31, 2010 and 2009, there were approximately $8.3 million and $5.3 million of unrecognized stock-based compensation expense related
to non-vested stock option awards that is expected to be recognized over a weighted average period of 2.76 and 2.49 years, respectively.
The weighted average remaining contractual term and the aggregate intrinsic value for options outstanding at December 31, 2010 was 7.36 years and
$17.7 million, respectively. The weighted average remaining contractual term and the aggregate intrinsic value for options exercisable at December 31, 2010
was 6.14 years and $15.7 million, respectively. As of December 31, 2010, options that were vested and exercisable totaled 1,099,555 shares of common stock
with a weighted average exercise price per share of $6.98.
F-25