Rosetta Stone 2010 Annual Report Download - page 108
Download and view the complete annual report
Please find page 108 of the 2010 Rosetta Stone annual report below. You can navigate through the pages in the report by either clicking on the pages listed below, or by using the keyword search tool below to find specific information within the annual report.-
 1
1 -
2
-
3
-
4
-
5
-
6
-
7
-
8
-
9
-
10
-
11
-
12
-
13
-
14
-
15
-
16
-
17
-
18
-
19
-
20
-
21
-
22
-
23
-
24
-
25
-
26
-
27
-
28
-
29
-
30
-
31
-
32
-
33
-
34
-
35
-
36
-
37
-
38
-
39
-
40
-
41
-
42
-
43
-
44
-
45
-
46
-
47
-
48
-
49
-
50
-
51
-
52
-
53
-
54
-
55
-
56
-
57
-
58
-
59
-
60
-
61
-
62
-
63
-
64
-
65
-
66
-
67
-
68
-
69
-
70
-
71
-
72
-
73
-
74
-
75
-
76
-
77
-
78
-
79
-
80
-
81
-
82
-
83
-
84
-
85
-
86
-
87
-
88
-
89
-
90
-
91
-
92
-
93
-
94
-
95
-
96
-
97
-
 98
98 -
 99
99 -
 100
100 -
 101
101 -
 102
102 -
 103
103 -
 104
104 -
 105
105 -
 106
106 -
 107
107 -
 108
108 -
 109
109 -
 110
110 -
 111
111 -
 112
112 -
 113
113 -
 114
114 -
 115
115 -
 116
116 -
 117
117 -
 118
118 -
119
-
120
-
121
-
122
-
123
-
124
-
125
-
126
-
127
-
128
-
129
-
130
-
131
-
132
-
133
-
134
-
135
-
136
-
137
-
138
-
139
-
140
-
141
-
142
-
143
-
144
-
145
-
146
-
147
-
148
-
149
-
150
-
151
-
152
-
153
 |
 |

Table of Contents
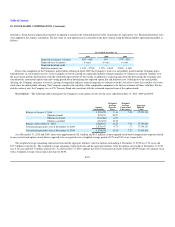
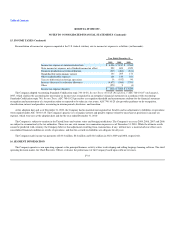
16. SEGMENT INFORMATION (Continued)
Products and services are sold primarily in the United States, but are also sold through direct and indirect sales channels in other countries, primarily in
Japan, South Korea and Europe. Less than 8% of the Company's revenues were generated from sales outside of the United States for the years ended
December 31, 2009 and 2008, and approximately 18% of the Company's revenue was generated from sales outside the United States for the year ended
December 31, 2010. As of December 31, 2010 and 2009, the Company had $2.7 million and $1.0 million, respectively, of long-lived assets held outside of the
United States.
No single customer accounted for more than 10% of the Company's revenue for the years ended December 31, 2010, 2009 and 2008, respectively.
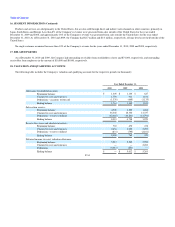
17. RELATED PARTIES
As of December 31, 2010 and 2009, the Company had outstanding receivables from stockholders of zero and $74,000, respectively, and outstanding
receivables from employees in the amount of $10,000 and $8,000, respectively.
18. VALUATION AND QUALIFYING ACCOUNTS
The following table includes the Company's valuation and qualifying accounts for the respective periods (in thousands):
Year Ended December 31,
2010 2009 2008
Allowance for doubtful accounts:
Beginning balance $ 1,349 $ 1,103 $ 627
Charged to costs and expenses 1,750 911 1,611
Deductions—accounts written off (1,338) (665) (1,135)
Ending balance 1,761 1,349 1,103
Sales return reserve:
Beginning balance 4,708 3,229 1,688
Charged to costs and expenses 36,348 18,340 14,337
Deductions—reserves utilized (32,665) (16,861) (12,796)
Ending balance 8,391 4,708 3,229
Reserve for excess and obsolete inventory:
Beginning balance 765 470 478
Charged to costs and expenses 2,454 1,090 2,093
Deductions—reserves utilized (831) (795) (2,101)
Ending balance 2,388 765 470
Deferred income tax asset valuation allowance:
Beginning balance 5,012 5,263 2,980
Charged to costs and expenses — — 2,283
Deductions (5,012) (251) —
Ending balance $ — $ 5,012 $ 5,263
F-34