Rosetta Stone 2010 Annual Report Download - page 42
Download and view the complete annual report
Please find page 42 of the 2010 Rosetta Stone annual report below. You can navigate through the pages in the report by either clicking on the pages listed below, or by using the keyword search tool below to find specific information within the annual report.-
 1
1 -
2
-
3
-
4
-
5
-
6
-
7
-
8
-
9
-
10
-
11
-
12
-
13
-
14
-
15
-
16
-
17
-
18
-
19
-
20
-
21
-
22
-
23
-
24
-
25
-
26
-
27
-
28
-
29
-
30
-
31
-
 32
32 -
 33
33 -
 34
34 -
 35
35 -
 36
36 -
 37
37 -
 38
38 -
 39
39 -
 40
40 -
 41
41 -
 42
42 -
 43
43 -
 44
44 -
 45
45 -
 46
46 -
 47
47 -
 48
48 -
 49
49 -
 50
50 -
 51
51 -
 52
52 -
53
-
54
-
55
-
56
-
57
-
58
-
59
-
60
-
61
-
62
-
63
-
64
-
65
-
66
-
67
-
68
-
69
-
70
-
71
-
72
-
73
-
74
-
75
-
76
-
77
-
78
-
79
-
80
-
81
-
82
-
83
-
84
-
85
-
86
-
87
-
88
-
89
-
90
-
91
-
92
-
93
-
94
-
95
-
96
-
97
-
98
-
99
-
100
-
101
-
102
-
103
-
104
-
105
-
106
-
107
-
108
-
109
-
110
-
111
-
112
-
113
-
114
-
115
-
116
-
117
-
118
-
119
-
120
-
121
-
122
-
123
-
124
-
125
-
126
-
127
-
128
-
129
-
130
-
131
-
132
-
133
-
134
-
135
-
136
-
137
-
138
-
139
-
140
-
141
-
142
-
143
-
144
-
145
-
146
-
147
-
148
-
149
-
150
-
151
-
152
-
153
 |
 |

Table of Contents
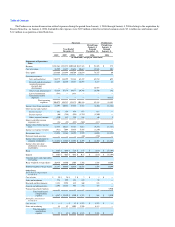
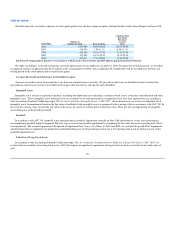
The Predecessor incurred transaction-related expenses during the period from January 1, 2006 through January 4, 2006 relating to the acquisition by
Rosetta Stone Inc. on January 4, 2006. Included in the expenses were $5.9 million related to restricted common stock, $3.1 million in cash bonuses and
$1.2 million in acquisition-related bank fees.
Successor Predecessor
Year Ended
December 31
Period from
January 4,
through
December 31,
Period from
January 1,
through
January 4,
2010 2009 2008 2007 2006 2006
(in thousands, except per share data)
Statements of Operations
Data:
Revenue $258,868 $252,271 $209,380 $137,321 $ 91,298 $ 272
Cost of revenue 38,999 33,427 28,676 20,687 12,541 203
Gross profit 219,869 218,844 180,704 116,634 78,757 69
Operating expenses:
Sales and marketing 130,879 114,899 93,384 65,437 45,854 695
Research and development 23,437 26,239 18,387 12,893 8,117 41
Acquired in-process
research and
development — — — — 12,597 —
General and administrative 53,239 57,174 39,577 29,786 16,590 142
Lease abandonment (583) — 1,831 — — —
Transaction-related
expenses — — — — — 10,315
Total operating
expenses 206,972 198,312 153,179 108,116 83,158 11,193
Income (loss) from operations 12,897 20,532 27,525 8,518 (4,401) (11,124)
Other income and expense:
Interest income 262 159 454 673 613 —
Interest expense (66) (356) (891) (1,331) (1,560) —
Other (expense) income (220) 112 239 154 60 3
Interest and other income
(expense), net (24) (85) (198) (504) (887) 3
Income (loss) before income
taxes 12,873 20,447 27,327 8,014 (5,288) (11,121)
Income tax expense (benefit) (411) 7,084 13,435 5,435 (1,240) —
Net income (loss) 13,284 13,363 13,892 2,579 (4,048) (11,121)
Preferred stock accretion — — — (80) (159) —
Income (loss) attributable to
common stockholders $ 13,284 $ 13,363 $ 13,892 $ 2,499 $ (4,207) $ (11,121)
Income (loss) per share
attributable to common
stockholders:
Basic $ 0.65 $ 0.89 $ 7.29 $ 1.47 $ (2.63) $ (37,194)
Diluted $ 0.63 $ 0.67 $ 0.82 $ 0.15 $ (2.63) $ (37,194)
Common shares and equivalents
outstanding:
Basic weighted average shares 20,439 14,990 1,905 1,702 1,598 0.299
Diluted weighted average shares 21,187 19,930 16,924 16,533 1,598 0.299
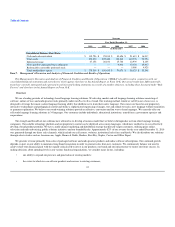
Other Data:
Stock-based compensation
included in:
Cost of sales $ 39 $ 34 $ 2 $ 2 $ 1 $ —
Sales and marketing 774 999 153 189 59 —
Research and development 1,181 5,959 482 360 128 —
General and administrative 2,393 15,158 953 776 373 —
Transaction-related expenses — — — — 5,930
Total stock-based
compensation
expense $ 4,387 $ 22,150 $ 1,590 $ 1,327 $ 561 $ 5,930
Intangible amortization
included in:
Cost of sales $ — $ — $ 13 $ 1,227 $ 1,213 $ —
Sales and marketing 58 42 3,003 3,596 4,113 —
Total intangible
amortization
expense $ 58 $ 42 $ 3,016 $ 4,823 $ 5,326 $ —