Rosetta Stone 2010 Annual Report Download - page 55
Download and view the complete annual report
Please find page 55 of the 2010 Rosetta Stone annual report below. You can navigate through the pages in the report by either clicking on the pages listed below, or by using the keyword search tool below to find specific information within the annual report.-
 1
1 -
2
-
3
-
4
-
5
-
6
-
7
-
8
-
9
-
10
-
11
-
12
-
13
-
14
-
15
-
16
-
17
-
18
-
19
-
20
-
21
-
22
-
23
-
24
-
25
-
26
-
27
-
28
-
29
-
30
-
31
-
32
-
33
-
34
-
35
-
36
-
37
-
38
-
39
-
40
-
41
-
42
-
43
-
44
-
 45
45 -
 46
46 -
 47
47 -
 48
48 -
 49
49 -
 50
50 -
 51
51 -
 52
52 -
 53
53 -
 54
54 -
 55
55 -
 56
56 -
 57
57 -
 58
58 -
 59
59 -
 60
60 -
 61
61 -
 62
62 -
 63
63 -
 64
64 -
 65
65 -
66
-
67
-
68
-
69
-
70
-
71
-
72
-
73
-
74
-
75
-
76
-
77
-
78
-
79
-
80
-
81
-
82
-
83
-
84
-
85
-
86
-
87
-
88
-
89
-
90
-
91
-
92
-
93
-
94
-
95
-
96
-
97
-
98
-
99
-
100
-
101
-
102
-
103
-
104
-
105
-
106
-
107
-
108
-
109
-
110
-
111
-
112
-
113
-
114
-
115
-
116
-
117
-
118
-
119
-
120
-
121
-
122
-
123
-
124
-
125
-
126
-
127
-
128
-
129
-
130
-
131
-
132
-
133
-
134
-
135
-
136
-
137
-
138
-
139
-
140
-
141
-
142
-
143
-
144
-
145
-
146
-
147
-
148
-
149
-
150
-
151
-
152
-
153
 |
 |

Table of Contents
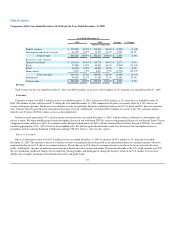
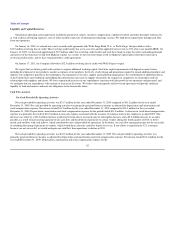
Comparison of the Year Ended December 31, 2010 and the Year Ended December 31, 2009
Year Ended December 31,
2010 2009 Change % Change
(dollars in thousands)
Product revenue $ 215,590 83.3% $ 218,549 86.6% $ (2,959) (1.4)%
Subscription and service revenue 43,278 16.7% 33,722 13.4% 9,556 28.3%
Total revenue 258,868 100.0% $ 252,271 100.0% $ 6,597 2.6%
Revenue by sales channel:
Direct-to-consumer $ 118,164 45.6% $ 115,791 45.9% $ 2,373 2.0%
Kiosk 35,000 13.5% 40,565 16.1% (5,565) (13.7)%
Retail 46,054 17.8% 45,894 18.2% 160 0.3%
Home school 5,045 1.9% 6,817 2.7% (1,772) (26.0)%
Total consumer 204,263 78.9% 209,067 82.9% (4,804) (2.3)%
Institutional 54,605 21.1% 43,204 17.1% 11,401 26.4%
Total revenue $ 258,868 100.0% $ 252,271 100.0% $ 6,597 2.6%
Revenue
Total revenue for the year ended December 31, 2010 was $258.9 million, an increase of $6.6 million, or 3%, from the year ended December 31, 2009.
Consumer
Consumer revenue was $204.3 million for the year ended December 31, 2010, a decrease of $4.8 million, or 2%, from the year ended December 31,
2009. The number of units sold decreased 7% during the year ended December 31, 2010 compared to the prior year period, offset by a 12% increase in
average selling price per unit. The decrease in consumer revenue was primarily driven by continued weakness in the U.S. kiosk and U.S. direct-to-consumer
sales verticals, offset by growth in our international consumer verticals. Additionally, we deferred $12.8 million in revenue in the U.S. consumer market
related to our Version 4 TOTALe online services as described below.
Product revenue represented 97% of total consumer revenue for the year ended December 31, 2010, with the balance attributable to subscription and
service revenue. We began bundling time-based subscription licenses of our web-based TOTALe services with perpetual licenses of our Rosetta Stone Version
3 language learning solutions in the U.S. consumer market during the third quarter of 2010 with the launch of Rosetta Stone Version 4 TOTALe. As a result,
we defer approximately 15% - 20% of each of these bundled sales. We will recognize the deferred revenue over the term of the subscription license in
accordance with Accounting Standards Codification subtopic 985-605, Software: Revenue Recognition.
Direct-to-Consumer
Direct-to-consumer revenue was $118.2 million for the year ended December 31, 2010 an increase of $2.4, million or 2%, from the year ended
December 31, 2009. The increase in direct-to-consumer revenue was primarily driven by growth in our international direct-to-consumer markets, offset by
continued decline in our U.S. direct-to-consumer business. The decline in our U.S. direct-to-consumer business was driven by lower web and call center
traffic. Additionally, the price of media increased causing a decline in returns on invested media. The downward trends in the U.S. could continue into 2011.
We are considering significant changes in our marketing, pricing, product and packaging to change the negative trends in the U.S. market. It is not clear
whether these changes will improve the downward revenue and profit trends.
52