Rosetta Stone 2010 Annual Report Download - page 62
Download and view the complete annual report
Please find page 62 of the 2010 Rosetta Stone annual report below. You can navigate through the pages in the report by either clicking on the pages listed below, or by using the keyword search tool below to find specific information within the annual report.-
 1
1 -
2
-
3
-
4
-
5
-
6
-
7
-
8
-
9
-
10
-
11
-
12
-
13
-
14
-
15
-
16
-
17
-
18
-
19
-
20
-
21
-
22
-
23
-
24
-
25
-
26
-
27
-
28
-
29
-
30
-
31
-
32
-
33
-
34
-
35
-
36
-
37
-
38
-
39
-
40
-
41
-
42
-
43
-
44
-
45
-
46
-
47
-
48
-
49
-
50
-
51
-
 52
52 -
 53
53 -
 54
54 -
 55
55 -
 56
56 -
 57
57 -
 58
58 -
 59
59 -
 60
60 -
 61
61 -
 62
62 -
 63
63 -
 64
64 -
 65
65 -
 66
66 -
 67
67 -
 68
68 -
 69
69 -
 70
70 -
 71
71 -
 72
72 -
73
-
74
-
75
-
76
-
77
-
78
-
79
-
80
-
81
-
82
-
83
-
84
-
85
-
86
-
87
-
88
-
89
-
90
-
91
-
92
-
93
-
94
-
95
-
96
-
97
-
98
-
99
-
100
-
101
-
102
-
103
-
104
-
105
-
106
-
107
-
108
-
109
-
110
-
111
-
112
-
113
-
114
-
115
-
116
-
117
-
118
-
119
-
120
-
121
-
122
-
123
-
124
-
125
-
126
-
127
-
128
-
129
-
130
-
131
-
132
-
133
-
134
-
135
-
136
-
137
-
138
-
139
-
140
-
141
-
142
-
143
-
144
-
145
-
146
-
147
-
148
-
149
-
150
-
151
-
152
-
153
 |
 |

Table of Contents
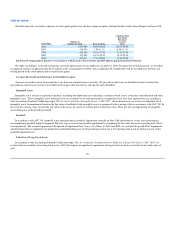
to core technology associated with the acquisition of Fairfield & Sons, Ltd., which was fully amortized in 2008. Cost of subscription and service revenue
increased by $1.0 million or 48% as we released Rosetta Stone TOTALe, our new web-based service offering that included a component of dedicated language
conversation coaching.
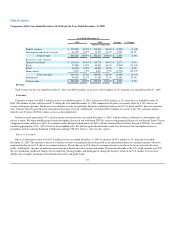
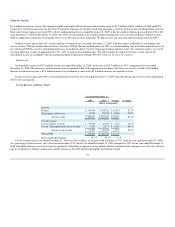
Operating Expenses
Year Ended December 31,
2009 2008 Change % Change
(dollars in thousands)
Sales and marketing $ 114,899 $ 93,384 $ 21,515 23.0%
Research and development 26,239 18,387 7,852 42.7%
General and administrative 57,182 39,577 17,605 44.5%
Lease abandonment (8) 1,831 (1,839) (100.4)%
Total operating expenses $ 198,312 $ 153,179 $ 45,133 29.5%
Sales and Marketing Expenses
Sales and marketing expenses for the year ended December 31, 2009 were $114.9 million, an increase of $21.5 million, or 23%, from the year ended
December 31, 2008. As a percentage of total revenue, sales and marketing expenses were 46% for the year ended December 31, 2009, compared to 45% for
the year ended December 31, 2008. The dollar and percentage increase in sales and marketing expenses were primarily attributable to the continued expansion
of our direct marketing activities. Advertising expenses grew by $8.6 million and were primarily related to television and radio media and internet marketing.
We also expanded the number of our kiosks from 150 as of December 31, 2008 to 242 as of December 31, 2009, which resulted in $6.2 million of additional
kiosk operating expenses, including rent and sales compensation related expenses. Personnel costs related to growth in our institutional sales channel and
marketing and sales support activities also increased by $6.4 million. The stock compensation charge related to a common stock grant to key employees in
connection with our initial public offering resulted in a $0.4 million increase in sales and marketing expense in 2009 compared to the prior year period.
Completion in January 2009 of the amortization of the intangible assets associated with the 2006 acquisition of Fairfield & Sons, Ltd. resulted in a
$3.0 million reduction in amortization expense in 2009 when compared to the prior year period.
Sales and marketing expenses without consideration of the stock compensation charge associated with the common stock grant to key employees in
connection with our initial public offering would have been $114.5 million, an increase of $21.1 million or 23% from the prior year. As a percentage of
revenue, sales and marketing expenses would have remained the same at 45% for the year ended December 31, 2009 compared to the prior year period.
Research and Development Expenses
Research and development expenses were $26.2 million for the year ended December 31 2009, an increase of $7.9 million, or 43%, from the year ended
December 31, 2008. As a percentage of total revenue, research and development expenses increased to 10% for the year ended December 31, 2009 compared
to 9% for the year ended December 31, 2008. The dollar and percentage increase were primarily attributable to a stock compensation charge related to
common stock awarded to key employees which resulted in a $5.0 million increase in research and development expense in 2009 when compared to the prior
year period. In addition, research and development expenses increased $3.0 million due to the addition of new product development personnel associated with
the development of new products and services that are complementary to our existing solutions.
59