Rosetta Stone 2010 Annual Report Download - page 57
Download and view the complete annual report
Please find page 57 of the 2010 Rosetta Stone annual report below. You can navigate through the pages in the report by either clicking on the pages listed below, or by using the keyword search tool below to find specific information within the annual report.-
 1
1 -
2
-
3
-
4
-
5
-
6
-
7
-
8
-
9
-
10
-
11
-
12
-
13
-
14
-
15
-
16
-
17
-
18
-
19
-
20
-
21
-
22
-
23
-
24
-
25
-
26
-
27
-
28
-
29
-
30
-
31
-
32
-
33
-
34
-
35
-
36
-
37
-
38
-
39
-
40
-
41
-
42
-
43
-
44
-
45
-
46
-
 47
47 -
 48
48 -
 49
49 -
 50
50 -
 51
51 -
 52
52 -
 53
53 -
 54
54 -
 55
55 -
 56
56 -
 57
57 -
 58
58 -
 59
59 -
 60
60 -
 61
61 -
 62
62 -
 63
63 -
 64
64 -
 65
65 -
 66
66 -
 67
67 -
68
-
69
-
70
-
71
-
72
-
73
-
74
-
75
-
76
-
77
-
78
-
79
-
80
-
81
-
82
-
83
-
84
-
85
-
86
-
87
-
88
-
89
-
90
-
91
-
92
-
93
-
94
-
95
-
96
-
97
-
98
-
99
-
100
-
101
-
102
-
103
-
104
-
105
-
106
-
107
-
108
-
109
-
110
-
111
-
112
-
113
-
114
-
115
-
116
-
117
-
118
-
119
-
120
-
121
-
122
-
123
-
124
-
125
-
126
-
127
-
128
-
129
-
130
-
131
-
132
-
133
-
134
-
135
-
136
-
137
-
138
-
139
-
140
-
141
-
142
-
143
-
144
-
145
-
146
-
147
-
148
-
149
-
150
-
151
-
152
-
153
 |
 |

Table of Contents
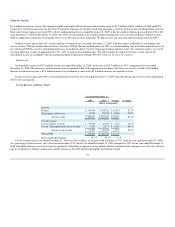
increase in education revenue, a $1.3 million increase in government revenue and a $5.8 million increase in corporate and non-profit revenue in 2010
compared to the prior year period.
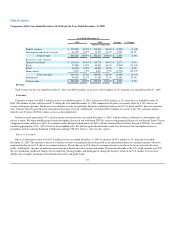
Product revenue represented 33% of total institutional revenue for the year ended December 31, 2010, and subscription and service revenue represented
67% for the same period.
Cost of Revenue and Gross Profit
Year Ended December 31,
2010 2009 Change % Change
(dollars in thousands)
Revenue:
Product $ 215,590 $ 218,549 $ (2,959) (1.4)%
Subscription and service 43,278 33,722 $ 9,556 28.3%
Total revenue $ 258,868 $ 252,271 $ 6,597 2.6%
Cost of revenue:
Cost of product revenue $ 32,549 $ 30,264 $ 2,285 7.6%
Cost of subscription and service revenue 6,450 3,163 $ 3,287 103.9%
Total cost of revenue 38,999 33,427 5,572 16.7%
Gross profit $ 219,869 $ 218,844 $ 1,025
Gross margin percentages 84.9% 86.7% (1.8)%
Cost of revenue for the year ended December 31, 2010 was $39.0 million, an increase of $5.6 million, or 17%, from the year ended December 31, 2009.
As a percentage of total revenue, cost of revenue increased to 15% for the year ended December 31, 2010 compared to 13% for the year ended December 31,
2009. Cost of product revenue for the year ended December 31, 2010 was $32.5 million, an increase of $2.3 million, or 8%, from the year ended
December 31, 2009. The increase in cost was primarily attributable to the $2.2 million increase in expense for inventory scrap of our V3 product associated
with the launch of Rosetta Stone Version 4 TOTALe in the U.S. market. We are exploring the possibility of changing our packaging in 2011, which could
result in an increase in the cost of our product revenue and additional charges as we replace the packaging within our sales channels.
Cost of subscription and service revenue for the year ended December 31, 2010 was $6.5 million, an increase of $3.3 million, or 104% from the year
ended December 31, 2009. The increase in cost was primarily attributable to our web-based service offering in our Version 4 TOTALe product that includes a
component of dedicated online language conversation coaching and higher direct costs to deliver to customers than our previous software solutions. We
expect our cost of subscription and service revenue will increase in future periods, as a percent of revenue, associated with the launch of our Version 4
TOTALe solution in our international markets.
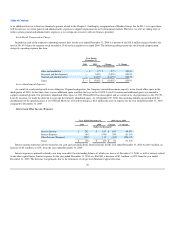
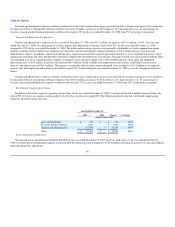
Operating Expenses
Year Ended
December 31,
2010 2009 Change % Change
(dollars in thousands)
Sales and marketing $ 130,879 $ 114,899 $ 15,980 13.9%
Research and development 23,437 26,239 (2,802) (10.7)%
General and administrative 53,239 57,182 (3,943) (6.9)%
Lease abandonment (583) (8) (575) 7187.5%
Total operating expenses $ 206,972 $ 198,312 $ 8,660 4.4%
54