Rosetta Stone 2010 Annual Report Download - page 61
Download and view the complete annual report
Please find page 61 of the 2010 Rosetta Stone annual report below. You can navigate through the pages in the report by either clicking on the pages listed below, or by using the keyword search tool below to find specific information within the annual report.-
 1
1 -
2
-
3
-
4
-
5
-
6
-
7
-
8
-
9
-
10
-
11
-
12
-
13
-
14
-
15
-
16
-
17
-
18
-
19
-
20
-
21
-
22
-
23
-
24
-
25
-
26
-
27
-
28
-
29
-
30
-
31
-
32
-
33
-
34
-
35
-
36
-
37
-
38
-
39
-
40
-
41
-
42
-
43
-
44
-
45
-
46
-
47
-
48
-
49
-
50
-
 51
51 -
 52
52 -
 53
53 -
 54
54 -
 55
55 -
 56
56 -
 57
57 -
 58
58 -
 59
59 -
 60
60 -
 61
61 -
 62
62 -
 63
63 -
 64
64 -
 65
65 -
 66
66 -
 67
67 -
 68
68 -
 69
69 -
 70
70 -
 71
71 -
72
-
73
-
74
-
75
-
76
-
77
-
78
-
79
-
80
-
81
-
82
-
83
-
84
-
85
-
86
-
87
-
88
-
89
-
90
-
91
-
92
-
93
-
94
-
95
-
96
-
97
-
98
-
99
-
100
-
101
-
102
-
103
-
104
-
105
-
106
-
107
-
108
-
109
-
110
-
111
-
112
-
113
-
114
-
115
-
116
-
117
-
118
-
119
-
120
-
121
-
122
-
123
-
124
-
125
-
126
-
127
-
128
-
129
-
130
-
131
-
132
-
133
-
134
-
135
-
136
-
137
-
138
-
139
-
140
-
141
-
142
-
143
-
144
-
145
-
146
-
147
-
148
-
149
-
150
-
151
-
152
-
153
 |
 |

Table of Contents
$4.6 million increase in revenue. The change in online subscription deferred revenue decreased revenue by $1.2 million and $0.1 million in 2008 and 2009,
respectively. Growth in unit sales was driven by the planned expansion of our direct marketing programs, as well as growth in our retail distribution network.
Direct advertising expenses increased 25% to $42.4 million during the year ended December 31, 2009, while the number of kiosks increased from 150 to 242
from December 31, 2008 to December 31, 2009. Our 2008 revenue includes a $2.6 million initial stocking order we received from Barnes & Noble in June
2008 to support their expansion of our product line to over 650 of their stores nationally. We did not have any such large initial stocking orders in 2009.
Product revenue represented 96% of total consumer revenue for the year ended December 31, 2009, with the balance attributable to subscription and
service revenue. With the launch of Rosetta Stone Version 4 TOTALe during the third quarter of 2010, we began bundling time-based subscription licenses of
our web-based TOTALe services with perpetual licenses of our Rosetta Stone Version 3 language learning solutions in the U.S. consumer market. As a result,
we began deferring revenue of approximately 15%—20% of each of these bundled sales. We will recognize the deferred revenue over the term of the
subscription license in accordance with Accounting Standards Codification subtopic 985-605, Software: Revenue Recognition.
Institutional
Institutional revenue was $43.2 million for the year ended December 31, 2009, an increase of $10.7 million, or 33%, compared to the year ended
December 31, 2008. The increase in institutional revenue was primarily due to the expansion of our direct sales force. As a result, we had a $4.8 million
increase in education revenue, a $3.9 million increase in government revenue and a $2.0 million increase in corporate revenue.
Product revenue represented 52% of total institutional revenue for the year ended December 31, 2009, and subscription and service revenue represented
48% for the same period.
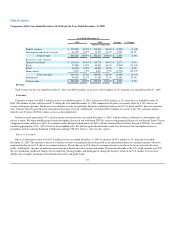
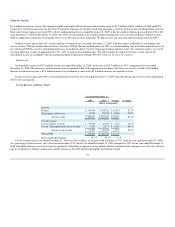
Cost of Revenue and Gross Profit
Year Ended December 31,
2009 2008 Change % Change
(dollars in thousands)
Revenue:
Product $ 218,549 $ 184,182 $ 34,367 18.7%
Subscription and service 33,722 25,198 $ 8,524 33.8%
Total revenue $ 252,271 $ 209,380 $ 42,891 20.5%
Cost of revenue:
Cost of product revenue $ 30,264 $ 26,539 $ 3,725 14.0%
Cost of subscription and service revenue 3,163 2,137 $ 1,026 48.0%
Total cost of revenue 33,427 28,676 4,751 16.6%
Gross profit $ 218,844 $ 180,704 $ 38,140
Gross margin percentages 86.7% 86.3% 0.4%
Cost of revenue for the year ended December 31, 2009 was $33.4 million, an increase of $4.8 million, or 17%, from the year ended December 31, 2008.
As a percentage of total revenue, cost of revenue decreased to 13% for the year ended December 31, 2009 compared to 14% for the year ended December 31,
2008. The dollar increase in cost of revenue was primarily attributable to expansion of our product offering combined with a change in our sales mix, offset in
part by a reduction in affiliate commissions and the absence in the 2009 period of intangible amortization related
58