Rosetta Stone 2010 Annual Report Download - page 56
Download and view the complete annual report
Please find page 56 of the 2010 Rosetta Stone annual report below. You can navigate through the pages in the report by either clicking on the pages listed below, or by using the keyword search tool below to find specific information within the annual report.-
 1
1 -
2
-
3
-
4
-
5
-
6
-
7
-
8
-
9
-
10
-
11
-
12
-
13
-
14
-
15
-
16
-
17
-
18
-
19
-
20
-
21
-
22
-
23
-
24
-
25
-
26
-
27
-
28
-
29
-
30
-
31
-
32
-
33
-
34
-
35
-
36
-
37
-
38
-
39
-
40
-
41
-
42
-
43
-
44
-
45
-
 46
46 -
 47
47 -
 48
48 -
 49
49 -
 50
50 -
 51
51 -
 52
52 -
 53
53 -
 54
54 -
 55
55 -
 56
56 -
 57
57 -
 58
58 -
 59
59 -
 60
60 -
 61
61 -
 62
62 -
 63
63 -
 64
64 -
 65
65 -
 66
66 -
67
-
68
-
69
-
70
-
71
-
72
-
73
-
74
-
75
-
76
-
77
-
78
-
79
-
80
-
81
-
82
-
83
-
84
-
85
-
86
-
87
-
88
-
89
-
90
-
91
-
92
-
93
-
94
-
95
-
96
-
97
-
98
-
99
-
100
-
101
-
102
-
103
-
104
-
105
-
106
-
107
-
108
-
109
-
110
-
111
-
112
-
113
-
114
-
115
-
116
-
117
-
118
-
119
-
120
-
121
-
122
-
123
-
124
-
125
-
126
-
127
-
128
-
129
-
130
-
131
-
132
-
133
-
134
-
135
-
136
-
137
-
138
-
139
-
140
-
141
-
142
-
143
-
144
-
145
-
146
-
147
-
148
-
149
-
150
-
151
-
152
-
153
 |
 |

Table of Contents
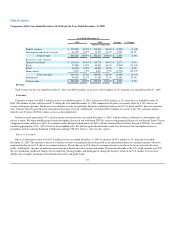
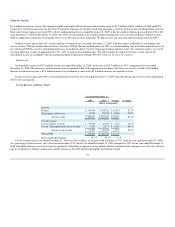
Kiosk
Kiosk revenue was $35.0 million for the year ended December 31, 2010, a decrease of $5.6 million, or 14%, from the year ended December 31, 2009.
Despite the increase in the number of worldwide kiosks from 242 to 259 during the year ended December 31, 2010, annual net revenue per kiosk declined due
to lower foot traffic. We plan to continually review kiosk performance in 2011 and we may close our underperforming kiosk locations.
Retail
Retail revenue was $46.1 million for the year ended December 31, 2010, an increase of $0.2 million or 0.3% from the year ended December 31, 2009.
The increase in retail revenue was primarily driven by holiday season stock in orders received from our larger retail partners during the fourth quarter of 2010,
as well as the expansion of our retail footprint with the addition of new retail relationships in 2010. During the fourth quarter of 2010, we reduced revenue by
$1.7 million as a result of changing our revenue recognition to cash basis for Borders, as a result of its Chapter 11 bankruptcy reorganization.
We work with retail partners to monitor quantity on hand and sell through of our product within the retail channel. As a result of lower than anticipated
sell through in our retail channel during the fourth quarter of 2010, we believe inventory levels at our two largest retail partners are higher than historical
levels. As such, we expect shipments of our products and related revenue to those retailers to be down substantially during the first quarter of 2011.
We are in the process of testing changes to the pricing of our products. If we reduce our prices as a result of successful tests in an effort to increase sales
volume and overall market penetration we may provide our retailers and distributors with price protection on existing inventories, which would allow these
retailers and distributors a credit against amounts owed with respect to unsold packaged product under certain conditions. These price protection reserves
could be material in future periods.
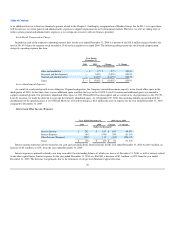
Home School
For the year ended December 31, 2010, we reclassified our home school sales vertical from Institutional to Consumer. We believe the drivers of
acquiring a home school customer are more aligned with a typical sale in our consumer sales vertical. Prior year information has been modified to conform to
current year presentation.
Home school revenue was $5.0 million for the year ended December 31, 2010, a decrease of $1.8 million or 26% from the year ended December 31,
2009. In 2009, we began offering home school edition products through other sales channels, including direct-to-consumer call centers and our retail channels.
As the availability of home school products in other sales channels increased during 2010, consumers began utilizing these new channels to make purchases.
For the year ended December 31, 2010, home school product sales through direct-to-consumer and retail increased by $0.4 million and $2.1 million,
respectively, from the year ended December 31, 2009. As sales through these new channels increased during 2010, sales from our traditional home school
channels, including home school resellers and the home school website, decreased $1.8 million. In the aggregate, revenue from sales of our home school
edition products increased $0.8 million during the twelve months ended December 31, 2010, compared to 2009.
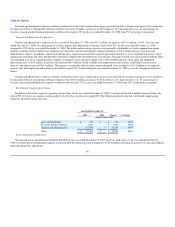
Institutional
Institutional revenue was $54.6 million for the year ended December 31, 2010, an increase of $11.4 million, or 26%, compared to the year ended
December 31, 2009. The increase in institutional revenue was primarily due to the expansion of our direct sales force. As a result, we had a $4.3 million
53