Rosetta Stone 2010 Annual Report Download - page 44
Download and view the complete annual report
Please find page 44 of the 2010 Rosetta Stone annual report below. You can navigate through the pages in the report by either clicking on the pages listed below, or by using the keyword search tool below to find specific information within the annual report.-
 1
1 -
2
-
3
-
4
-
5
-
6
-
7
-
8
-
9
-
10
-
11
-
12
-
13
-
14
-
15
-
16
-
17
-
18
-
19
-
20
-
21
-
22
-
23
-
24
-
25
-
26
-
27
-
28
-
29
-
30
-
31
-
32
-
33
-
 34
34 -
 35
35 -
 36
36 -
 37
37 -
 38
38 -
 39
39 -
 40
40 -
 41
41 -
 42
42 -
 43
43 -
 44
44 -
 45
45 -
 46
46 -
 47
47 -
 48
48 -
 49
49 -
 50
50 -
 51
51 -
 52
52 -
 53
53 -
 54
54 -
55
-
56
-
57
-
58
-
59
-
60
-
61
-
62
-
63
-
64
-
65
-
66
-
67
-
68
-
69
-
70
-
71
-
72
-
73
-
74
-
75
-
76
-
77
-
78
-
79
-
80
-
81
-
82
-
83
-
84
-
85
-
86
-
87
-
88
-
89
-
90
-
91
-
92
-
93
-
94
-
95
-
96
-
97
-
98
-
99
-
100
-
101
-
102
-
103
-
104
-
105
-
106
-
107
-
108
-
109
-
110
-
111
-
112
-
113
-
114
-
115
-
116
-
117
-
118
-
119
-
120
-
121
-
122
-
123
-
124
-
125
-
126
-
127
-
128
-
129
-
130
-
131
-
132
-
133
-
134
-
135
-
136
-
137
-
138
-
139
-
140
-
141
-
142
-
143
-
144
-
145
-
146
-
147
-
148
-
149
-
150
-
151
-
152
-
153
 |
 |

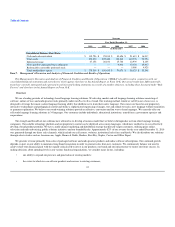
Table of Contents
Sucessor
Year Ended December 31,
2010 2009 2008 2007 2006
(in thousands)
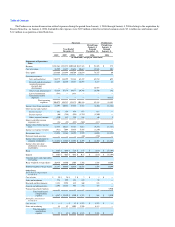
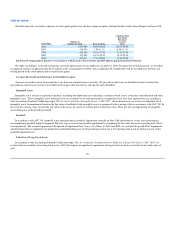
Consolidated Balance Sheet Data:
Cash and cash equivalents $ 115,756 $ 95,188 $ 30,626 $ 21,691 $ 16,917
Total assets 276,474 225,442 138,818 110,376 96,754
Deferred revenue 47,158 26,106 15,744 12,939 8,105
Notes payable and capital lease obligation — — 9,910 13,324 15,917
Redeemable convertible preferred stock — — — 5,000 4,920
Total stockholders' equity $ 178,316 $ 156,435 $ 79,071 $ 58,125 $ 53,548
Item 7. Management's Discussion and Analysis of Financial Condition and Results of Operations
This Management's Discussion and Analysis of Financial Condition and Results of Operations ("MD&A") should be read in conjunction with our
consolidated financial statements and notes thereto which appear elsewhere in this Annual Report on Form 10-K. Our actual results may differ materially
from those currently anticipated and expressed in such forward-looking statements as a result of a number of factors, including those discussed under "Risk
Factors" and elsewhere in this Annual Report on Form 10-K.
Overview
We are a leading provider of technology-based language learning solutions. We develop, market and sell language learning solutions consisting of
software, online services and audio practice tools primarily under our Rosetta Stone brand. Our teaching method, which we call Dynamic Immersion, is
designed to leverage the innate, natural language learning ability that children use to learn their native language. Our courses are based on our proprietary
interactive technologies and pedagogical content and utilize a sophisticated sequencing of images, text and sounds to teach a new language without translation
or grammar explanation. We believe our award-winning solutions provide an effective, convenient and fun way to learn languages. We currently offer our
self-study language learning solutions in 34 languages. Our customers include individuals, educational institutions, armed forces, government agencies and
corporations.
The strength and breadth of our solutions have allowed us to develop a business model that we believe distinguishes us from other language learning
companies. Our scalable technology platform and our proprietary content can be deployed across many languages, which have enabled us to cost-effectively
develop a broad product portfolio. We have a multi-channel marketing and distribution strategy that directly targets customers, utilizing print, online,
television and radio advertising, public relations initiatives and our branded kiosks. Approximately 82% of our revenue for the year ended December 31, 2010
was generated through our direct sales channels, which include our call centers, websites, institutional sales force and kiosks. We also distribute our solutions
through select retailers such as Amazon.com, Apple, Barnes & Noble, Borders, Best Buy, Staples, Costco and Office Depot.
We generate revenue primarily from sales of packaged software and audio practice products and online software subscriptions. Our continued growth
depends, in part, on our ability to maintain strong brand recognition in order to generate sales from new customers. We continuously balance our need to
achieve short-term financial goals with the equally critical need to invest in our products, our brand and our infrastructure to ensure our future success. In
making decisions about spending levels in our various functional organizations, we consider many factors, including:
our ability to expand our presence and penetration of existing markets;
the extent to which we can sell new products and services to existing customers;
41
•
•