Rosetta Stone 2010 Annual Report Download - page 64
Download and view the complete annual report
Please find page 64 of the 2010 Rosetta Stone annual report below. You can navigate through the pages in the report by either clicking on the pages listed below, or by using the keyword search tool below to find specific information within the annual report.-
 1
1 -
2
-
3
-
4
-
5
-
6
-
7
-
8
-
9
-
10
-
11
-
12
-
13
-
14
-
15
-
16
-
17
-
18
-
19
-
20
-
21
-
22
-
23
-
24
-
25
-
26
-
27
-
28
-
29
-
30
-
31
-
32
-
33
-
34
-
35
-
36
-
37
-
38
-
39
-
40
-
41
-
42
-
43
-
44
-
45
-
46
-
47
-
48
-
49
-
50
-
51
-
52
-
53
-
 54
54 -
 55
55 -
 56
56 -
 57
57 -
 58
58 -
 59
59 -
 60
60 -
 61
61 -
 62
62 -
 63
63 -
 64
64 -
 65
65 -
 66
66 -
 67
67 -
 68
68 -
 69
69 -
 70
70 -
 71
71 -
 72
72 -
 73
73 -
 74
74 -
75
-
76
-
77
-
78
-
79
-
80
-
81
-
82
-
83
-
84
-
85
-
86
-
87
-
88
-
89
-
90
-
91
-
92
-
93
-
94
-
95
-
96
-
97
-
98
-
99
-
100
-
101
-
102
-
103
-
104
-
105
-
106
-
107
-
108
-
109
-
110
-
111
-
112
-
113
-
114
-
115
-
116
-
117
-
118
-
119
-
120
-
121
-
122
-
123
-
124
-
125
-
126
-
127
-
128
-
129
-
130
-
131
-
132
-
133
-
134
-
135
-
136
-
137
-
138
-
139
-
140
-
141
-
142
-
143
-
144
-
145
-
146
-
147
-
148
-
149
-
150
-
151
-
152
-
153
 |
 |

Table of Contents
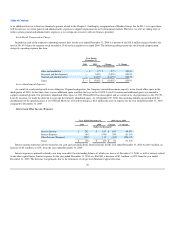
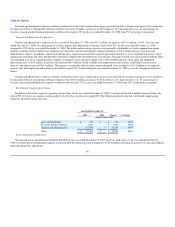
Interest and Other Income (Expense)
Year Ended December 31,
2009 2008 Change % Change
(dollars in thousands)
Interest income $ 159 $ 454 $ (295) (65.0)%
Interest expense (356) (891) $ 535 (60.0)%
Other income 112 239 $ (127) (53.1)%
Total $ (85) $ (198) $ 113 (57.1)%
Interest income represents interest earned on our cash and cash equivalents. Interest income for the year ended December 31, 2009 was $0.2 million, a
decrease of $0.3 million, or 65%, from the year ended December 31, 2008. Interest expense is primarily related to our long-term debt, the outstanding balance
of which was zero as of December 31, 2009. Interest expense for the year ended December 31, 2009 was $0.4 million, a decrease of $0.5 million, or 60%
from the year ended December 31, 2008. The decrease was primarily due to the retirement of our previous Madison Capital term loan. Other income for the
year ended December 31, 2009 was $0.1 million, a decrease of $0.1 million, or 53% and is primarily due to foreign currency fluctuations.
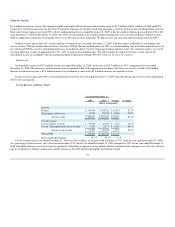
Income Tax Expense
Year Ended December 31,
2009 2008 Change % Change
(dollars in thousands)
Income tax expense $ 7,084 $ 13,435 $ (6,351) (47.3)%
Income tax expense for the year ended December 31, 2009 was $7.1 million, a decrease of $6.4 million, or 47%, compared to the year ended
December 31, 2008. The decrease was the result of a decrease of $6.9 million in pre-tax income for the year ended December 31, 2009 and a lower effective
tax rate, compared to the year ended December 31, 2008. Our effective tax rate decreased to 35% for the year ended December 31, 2009 compared to 49% for
the year ended December 31, 2008. The reduction in our effective tax rate was a result of changes in the geographic distribution of our income and a change
in our transfer pricing agreements.
We determine the pricing among our associated entities on the basis of detailed functional and economic analysis involving benchmarking against
transactions among entities that are not under common control. Based on our analysis, we made changes to the transfer pricing agreements effective
January 1, 2009. The resulting change in geographic distributions of income contributed to a lower effective tax rate as compared to the year ended
December 31, 2008.
We do not currently record income tax on the results of our U.K., Japan or Germany subsidiaries. Despite enacting certain tax planning strategies during
the year ended December 31, 2009, no subsidiary has produced sustainable pretax profits as of December 31, 2009 and each remains in a three-year
cumulative loss position. Accordingly we continue to carry a full valuation allowance on net operating loss carryforwards and other deferred tax assets for
these jurisdictions. As we continue operations in accordance with the revised transfer pricing agreements, we will monitor actual results and updated
projections on a quarterly basis. When and if the subsidiaries realize or realistically anticipate sustainable profitability, we will assess the appropriateness of
releasing the valuation allowance in whole or in part.
61