Rosetta Stone 2010 Annual Report Download - page 87
Download and view the complete annual report
Please find page 87 of the 2010 Rosetta Stone annual report below. You can navigate through the pages in the report by either clicking on the pages listed below, or by using the keyword search tool below to find specific information within the annual report.-
 1
1 -
2
-
3
-
4
-
5
-
6
-
7
-
8
-
9
-
10
-
11
-
12
-
13
-
14
-
15
-
16
-
17
-
18
-
19
-
20
-
21
-
22
-
23
-
24
-
25
-
26
-
27
-
28
-
29
-
30
-
31
-
32
-
33
-
34
-
35
-
36
-
37
-
38
-
39
-
40
-
41
-
42
-
43
-
44
-
45
-
46
-
47
-
48
-
49
-
50
-
51
-
52
-
53
-
54
-
55
-
56
-
57
-
58
-
59
-
60
-
61
-
62
-
63
-
64
-
65
-
66
-
67
-
68
-
69
-
70
-
71
-
72
-
73
-
74
-
75
-
76
-
 77
77 -
 78
78 -
 79
79 -
 80
80 -
 81
81 -
 82
82 -
 83
83 -
 84
84 -
 85
85 -
 86
86 -
 87
87 -
 88
88 -
 89
89 -
 90
90 -
 91
91 -
 92
92 -
 93
93 -
 94
94 -
 95
95 -
 96
96 -
 97
97 -
98
-
99
-
100
-
101
-
102
-
103
-
104
-
105
-
106
-
107
-
108
-
109
-
110
-
111
-
112
-
113
-
114
-
115
-
116
-
117
-
118
-
119
-
120
-
121
-
122
-
123
-
124
-
125
-
126
-
127
-
128
-
129
-
130
-
131
-
132
-
133
-
134
-
135
-
136
-
137
-
138
-
139
-
140
-
141
-
142
-
143
-
144
-
145
-
146
-
147
-
148
-
149
-
150
-
151
-
152
-
153
 |
 |

Table of Contents
ROSETTA STONE INC.
NOTES TO CONSOLIDATED FINANCIAL STATEMENTS (Continued)
2. SUMMARY OF SIGNIFICANT ACCOUNTING POLICIES (Continued)
unobservable inputs. Observable inputs reflect market data obtained from independent sources, while unobservable inputs reflect our market assumptions.
These two types of inputs create the following fair value hierarchy:
Level 1: Quoted prices for identical instruments in active markets.
Level 2: Quoted prices for similar instruments in active markets; quoted prices for identical or similar instruments in markets that are not active; and
model-derived valuations whose inputs are observable or whose significant value drivers are observable.
Level 3: Significant inputs to the valuation model are unobservable.
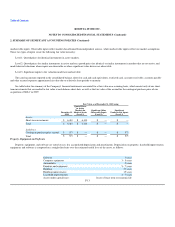
The carrying amounts reported in the consolidated balance sheets for cash and cash equivalents, restricted cash, accounts receivable, accounts payable
and other accrued expenses approximate fair value due to relatively short periods to maturity.
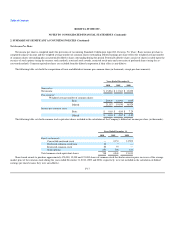
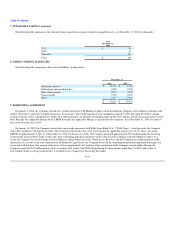
See table below for summary of the Company's financial instruments accounted for at fair value on a recurring basis, which consist only of our short-
term investments that are marked to fair value at each balance sheet date, as well as the fair value of the accrual for the contingent purchase price of our
acquisition of SGLC in 2009:
Fair Value as of December 31, 2010 using:
December 31,
2010
Quoted Prices
in Active
Markets for
Identical Assets
(Level 1)
Significant Other
Observable Inputs
(Level 2)
Significant
Unobservable Inputs
(Level 3)
Assets:
Short-term investments $ 6,410 $ 6,410 $ — $ —
Total $ 6,410 $ 6,410 $ — $ —
Liabilities:
Contingent purchase price accrual $ 573 $ — $ — $ 573
Total $ 573 $ — $ — $ 573
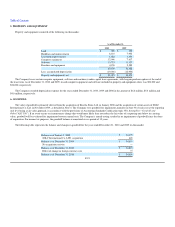
Property, Equipment and Software
Property, equipment, and software are stated at cost, less accumulated depreciation and amortization. Depreciation on property, leasehold improvements,
equipment, and software is computed on a straight-line basis over the estimated useful lives of the assets, as follows:
Software 3 years
Computer equipment 3 - 5 years
Automobiles 5 years
Furniture and equipment 5 - 7 years
Building 39 years
Building improvements 15 years
Leasehold improvements 4 - 7 years
Assets under capital leases lesser of lease term or economic life
F-13