Rosetta Stone 2010 Annual Report Download - page 60
Download and view the complete annual report
Please find page 60 of the 2010 Rosetta Stone annual report below. You can navigate through the pages in the report by either clicking on the pages listed below, or by using the keyword search tool below to find specific information within the annual report.-
 1
1 -
2
-
3
-
4
-
5
-
6
-
7
-
8
-
9
-
10
-
11
-
12
-
13
-
14
-
15
-
16
-
17
-
18
-
19
-
20
-
21
-
22
-
23
-
24
-
25
-
26
-
27
-
28
-
29
-
30
-
31
-
32
-
33
-
34
-
35
-
36
-
37
-
38
-
39
-
40
-
41
-
42
-
43
-
44
-
45
-
46
-
47
-
48
-
49
-
 50
50 -
 51
51 -
 52
52 -
 53
53 -
 54
54 -
 55
55 -
 56
56 -
 57
57 -
 58
58 -
 59
59 -
 60
60 -
 61
61 -
 62
62 -
 63
63 -
 64
64 -
 65
65 -
 66
66 -
 67
67 -
 68
68 -
 69
69 -
 70
70 -
71
-
72
-
73
-
74
-
75
-
76
-
77
-
78
-
79
-
80
-
81
-
82
-
83
-
84
-
85
-
86
-
87
-
88
-
89
-
90
-
91
-
92
-
93
-
94
-
95
-
96
-
97
-
98
-
99
-
100
-
101
-
102
-
103
-
104
-
105
-
106
-
107
-
108
-
109
-
110
-
111
-
112
-
113
-
114
-
115
-
116
-
117
-
118
-
119
-
120
-
121
-
122
-
123
-
124
-
125
-
126
-
127
-
128
-
129
-
130
-
131
-
132
-
133
-
134
-
135
-
136
-
137
-
138
-
139
-
140
-
141
-
142
-
143
-
144
-
145
-
146
-
147
-
148
-
149
-
150
-
151
-
152
-
153
 |
 |

Table of Contents
Other expense for the year ended December 31, 2010 was $0.2 million compared to other income of $0.1 million for the year ended December 31, 2009,
a decrease of $0.3 million or 296%. The decrease is primarily the result of foreign exchange losses and a decrease in trademark infringement awards.
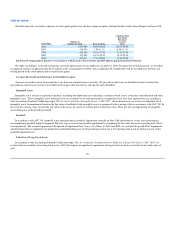
Income Tax Expense (Benefit)
Year Ended December 31,
2010 2009 Change % Change
(dollars in thousands)
Income tax expense (benefit) $ (411) $ 7,084 $ (7,495) (105.8)%
Income tax benefit for the year ended December 31, 2010 was $0.4 million, a decrease of $7.5 million, or 106%, compared to the year ended
December 31, 2009. The decrease was the result of a decrease of $7.6 million in pre-tax income for the year ended December 31, 2010 and a lower effective
tax rate, compared to the year ended December 31, 2009. Our effective tax rate decreased to (3%) for the year ended December 31, 2010 compared to 35% for
the year ended December 31, 2009. The reduction in our effective tax rate was a result of changes in the geographic distribution of our income and the release
of the valuation allowance on net operating loss carryforwards and other deferred tax assets of our U.K. and Japan subsidiaries. In 2011, we expect our
income tax rate to increase to levels comparable to 2009.
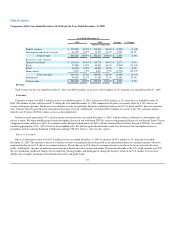
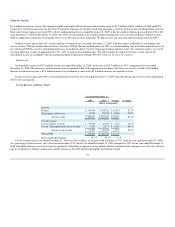
Comparison of the Year Ended December 31, 2009 and the Year Ended December 31, 2008
Year Ended December 31,
2009 2008 Change % Change
(dollars in thousands)
Product revenue $ 218,549 86.6% $ 184,182 88.0% $ 34,367 18.7%
Subscription and service revenue 33,722 13.4% 25,198 12.0% 8,524 33.8%
Total revenue $ 252,271 100.0% $ 209,380 100.0% $ 42,891 20.5%
Revenue by sales channel:
Direct-to-consumer $ 115,791 45.9% $ 96,702 46.2% $ 19,089 19.7%
Kiosk 40,565 16.1% 36,314 17.3% 4,251 11.7%
Retail 45,894 18.2% 34,638 16.5% 11,256 32.5%
Home school 6,817 2.7% 9,170 4.4% (2,353) (25.7)%
Total consumer 209,067 82.9% 176,824 84.5% 32,243 18.2%
Institutional 43,204 17.1% 32,556 15.5% $ 10,648 32.7%
Total revenue $ 252,271 100.0% $ 209,380 100.0% $ 42,891 20.5%
Revenue
Total revenue for the year ended December 31, 2009 was $252.3 million, an increase of $42.9 million, or 21%, from the year ended December 31, 2008.
Consumer
Consumer revenue was $209.1 million for the year ended December 31, 2009, an increase of $32.2 million, or 18%, from the year ended December 31,
2008. The increase in consumer revenue was attributable to a 3% increase in unit sales, which resulted in a $26.5 million increase in revenue, combined with a
14% increase in the average selling price of each unit, which accounted for a
57