Rosetta Stone 2010 Annual Report Download - page 58
Download and view the complete annual report
Please find page 58 of the 2010 Rosetta Stone annual report below. You can navigate through the pages in the report by either clicking on the pages listed below, or by using the keyword search tool below to find specific information within the annual report.-
 1
1 -
2
-
3
-
4
-
5
-
6
-
7
-
8
-
9
-
10
-
11
-
12
-
13
-
14
-
15
-
16
-
17
-
18
-
19
-
20
-
21
-
22
-
23
-
24
-
25
-
26
-
27
-
28
-
29
-
30
-
31
-
32
-
33
-
34
-
35
-
36
-
37
-
38
-
39
-
40
-
41
-
42
-
43
-
44
-
45
-
46
-
47
-
 48
48 -
 49
49 -
 50
50 -
 51
51 -
 52
52 -
 53
53 -
 54
54 -
 55
55 -
 56
56 -
 57
57 -
 58
58 -
 59
59 -
 60
60 -
 61
61 -
 62
62 -
 63
63 -
 64
64 -
 65
65 -
 66
66 -
 67
67 -
 68
68 -
69
-
70
-
71
-
72
-
73
-
74
-
75
-
76
-
77
-
78
-
79
-
80
-
81
-
82
-
83
-
84
-
85
-
86
-
87
-
88
-
89
-
90
-
91
-
92
-
93
-
94
-
95
-
96
-
97
-
98
-
99
-
100
-
101
-
102
-
103
-
104
-
105
-
106
-
107
-
108
-
109
-
110
-
111
-
112
-
113
-
114
-
115
-
116
-
117
-
118
-
119
-
120
-
121
-
122
-
123
-
124
-
125
-
126
-
127
-
128
-
129
-
130
-
131
-
132
-
133
-
134
-
135
-
136
-
137
-
138
-
139
-
140
-
141
-
142
-
143
-
144
-
145
-
146
-
147
-
148
-
149
-
150
-
151
-
152
-
153
 |
 |

Table of Contents
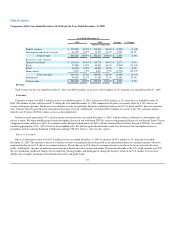
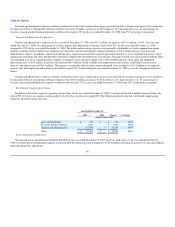
Sales and Marketing Expenses
Sales and marketing expenses for the year ended December 31, 2010 were $130.9 million, an increase of $16.0 million, or 14%, from the year ended
December 31, 2009. As a percentage of total revenue, sales and marketing expenses were 51% for the year ended December 31, 2010, compared to 46% for
the year ended December 31, 2009. The dollar and percentage increase in sales and marketing expenses were primarily attributable to the continued expansion
of our direct marketing activities in the U.S. and international markets. Personnel costs related to growth in our institutional sales channel and marketing and
sales support activities increased by $6.2 million over the prior year period. Advertising and marketing expenses grew by $5.9 million and were primarily
related to television and radio media and retail visual displays associated with our launch of Rosetta Stone Version 4 TOTALe. Travel and training expense
increased by $1.1 million over the prior year period as a result of increased travel in our institutional sales channel and global initiatives. We also expanded
the number of our kiosks from 242 as of December 31, 2009 to 259 as of December 31, 2010, which resulted in $3.3 million of additional kiosk operating
expenses, including rent and sales compensation related expenses. These increases were partially offset by a reduction in stock compensation charge related to
common stock awarded to key employees in 2009, resulting in a $0.4 million decrease in sales and marketing expense in the 2010 period. In the U.S. market
we are considering, among other alternatives changing our media strategy to include advertising that promotes language learning and our brand. This change
could increase our marketing expenses relative to revenue in future periods.
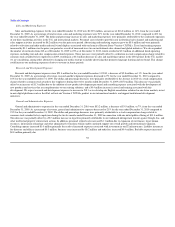
Research and Development Expenses
Research and development expenses were $23.4 million for the year ended December 31 2010, a decrease of $2.8 million, or 11%, from the year ended
December 31, 2009. As a percentage of revenue, research and development expenses decreased to 9% for the year ended December 31, 2010 compared to
10% for the year ended December 31, 2009. The dollar and percentage decreases were primarily attributable to the absence in 2010 of a stock compensation
charge related to common stock awards to key employees during the twelve months ended December 31, 2009 of $5.0 million. This decrease was partially
offset by an increase of $1.3 million due to the addition of new product development personnel and consulting expense associated with the development of
new products and services that are complementary to our existing solutions, and a $0.4 million increase in travel and training associated with this
development. We expect research and development expenses to increase in 2011 as we develop our English remediation solution for our Asian markets, invest
in new digital platforms such as the iPad, roll out our Version 4 TOTALe product in our international markets, and support institutional development
initiatives.
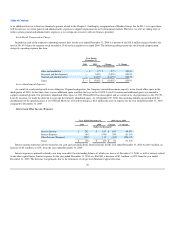
General and Administrative Expenses
General and administrative expenses for the year ended December 31, 2010 were $53.2 million, a decrease of $3.9 million, or 7%, from the year ended
December 31, 2009. As a percentage of revenue, general and administrative expenses decreased to 21% for the year ended December 31, 2010 compared to
23% for the year ended December 31, 2009. The dollar and percentage decreases were primarily attributable to a stock compensation charge related to
common stock awarded to key employees during the twelve months ended December 31, 2009 in connection with our initial public offering of $13.4 million.
This decrease was partially offset by a $5.3 million increase in legal fees primarily attributable to our trademark infringement lawsuit against Google, Inc. and
other intellectual property enforcement actions. In addition, personnel related costs increased $1.1 million due to expansion of our finance, legal, human
resources, information technology and other administrative functions which enable continued support our overall growth and international expansion.
Consulting expense increased $1.0 million primarily the result of increased expenses associated with investment in our IT infrastructure. Liability insurances
for directors and officers increased $0.3 million, business taxes increased by $0.2 million and audit fees increased $0.4 million. Bad debt expense increased
$0.8 million primarily due
55