Redbox 2011 Annual Report Download - page 86
Download and view the complete annual report
Please find page 86 of the 2011 Redbox annual report below. You can navigate through the pages in the report by either clicking on the pages listed below, or by using the keyword search tool below to find specific information within the annual report.-
 1
1 -
2
-
3
-
4
-
5
-
6
-
7
-
8
-
9
-
10
-
11
-
12
-
13
-
14
-
15
-
16
-
17
-
18
-
19
-
20
-
21
-
22
-
23
-
24
-
25
-
26
-
27
-
28
-
29
-
30
-
31
-
32
-
33
-
34
-
35
-
36
-
37
-
38
-
39
-
40
-
41
-
42
-
43
-
44
-
45
-
46
-
47
-
48
-
49
-
50
-
51
-
52
-
53
-
54
-
55
-
56
-
57
-
58
-
59
-
60
-
61
-
62
-
63
-
64
-
65
-
66
-
67
-
68
-
69
-
70
-
71
-
72
-
73
-
74
-
75
-
 76
76 -
 77
77 -
 78
78 -
 79
79 -
 80
80 -
 81
81 -
 82
82 -
 83
83 -
 84
84 -
 85
85 -
 86
86 -
 87
87 -
 88
88 -
 89
89 -
 90
90 -
 91
91 -
 92
92 -
 93
93 -
 94
94 -
 95
95 -
 96
96 -
97
-
98
-
99
-
100
-
101
-
102
-
103
-
104
-
105
-
106
 |
 |

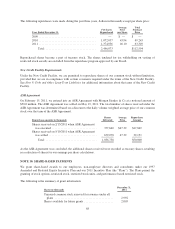
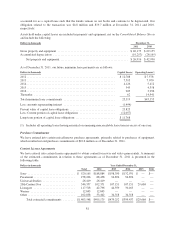
Revenue is allocated to geographic locations based on the location of the kiosk. Revenue by geographic location
was as follows (in thousands):
Year Ended December 31,
2011 2010 2009
U.S. ...................................................... $1,802,350 $1,395,821 $ 995,884
All other ................................................... 43,021 40,600 36,739
Total revenue ........................................... $1,845,371 $1,436,421 $1,032,623
Long-lived assets by geographic location were as follows (in thousands):
December 31,
2011 2010 2009
U.S. ...................................................... $798,840 $775,208 $765,724
All other ................................................... 17,007 19,109 17,598
Total long-lived assets .................................... $815,847 $794,317 $783,322
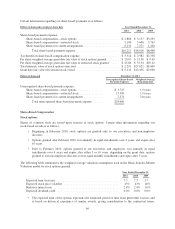
NOTE 15: RETIREMENT PLANS
We sponsor a defined contribution plan for our employees who satisfy certain age and service requirements. Our
Redbox subsidiary also sponsors a defined contribution plan to which new contributions were frozen effective
January 1, 2010. Our contributions to these plans were $3.2 million, $2.8 million and $1.9 million in 2011, 2010
and 2009, respectively.
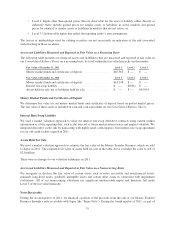
NOTE 16: DERIVATIVE INSTRUMENTS
Interest Rate Swaps
Our interest rate swap agreement with Wells Fargo Bank to hedge against the variable-rate interest payments on
our revolving credit facility expired on March 20, 2011. As of December 31, 2011, we had no interest rate swaps
outstanding that were accounted for as cash flow hedges.
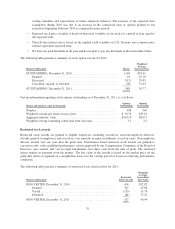
The fair value of the interest rate swap as of December 31, 2010 was a liability of $896,000, which was reversed
from comprehensive income and recognized as interest expense in our Consolidated Statements of Net Income in
the first quarter of 2011.
The effect of derivative instruments on our Consolidated Statements of Net Income was as follows (in
thousands):
Interest Rate Swap Contract
Year ended December 31,
Derivatives in Cash Flow Hedging Relationship (Dollars in thousands) 2011 2010 2009
Effective portion of derivative gain recognized in OCI .............. $896 $4,477 $ 2,092
Effective portion of derivative loss reclassified from accumulated OCI
to expense ............................................... $(889) $(5,553) $(5,673)
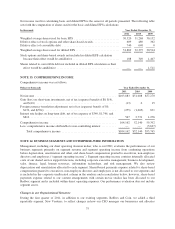
NOTE 17: FAIR VALUE
Fair value is the price that would be received to sell an asset or paid to transfer a liability (an exit price) in the
principal or most advantageous market for the asset or liability in an orderly transaction between market
participants on the measurement date. To measure fair value, we use a three-tier valuation hierarchy based upon
observable and non-observable inputs:
• Level 1: Observable inputs such as quoted prices in active markets for identical assets or liabilities;
78