Redbox 2011 Annual Report Download - page 45
Download and view the complete annual report
Please find page 45 of the 2011 Redbox annual report below. You can navigate through the pages in the report by either clicking on the pages listed below, or by using the keyword search tool below to find specific information within the annual report.-
 1
1 -
2
-
3
-
4
-
5
-
6
-
7
-
8
-
9
-
10
-
11
-
12
-
13
-
14
-
15
-
16
-
17
-
18
-
19
-
20
-
21
-
22
-
23
-
24
-
25
-
26
-
27
-
28
-
29
-
30
-
31
-
32
-
33
-
34
-
 35
35 -
 36
36 -
 37
37 -
 38
38 -
 39
39 -
 40
40 -
 41
41 -
 42
42 -
 43
43 -
 44
44 -
 45
45 -
 46
46 -
 47
47 -
 48
48 -
 49
49 -
 50
50 -
 51
51 -
 52
52 -
 53
53 -
 54
54 -
 55
55 -
56
-
57
-
58
-
59
-
60
-
61
-
62
-
63
-
64
-
65
-
66
-
67
-
68
-
69
-
70
-
71
-
72
-
73
-
74
-
75
-
76
-
77
-
78
-
79
-
80
-
81
-
82
-
83
-
84
-
85
-
86
-
87
-
88
-
89
-
90
-
91
-
92
-
93
-
94
-
95
-
96
-
97
-
98
-
99
-
100
-
101
-
102
-
103
-
104
-
105
-
106
 |
 |

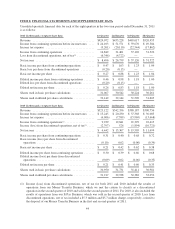
Adjusted EBITDA from Continuing Operations
We use the non-GAAP financial measure adjusted earnings, before interest, taxes, depreciation, amortization and
other, and share-based payment expense from continuing operations (“adjusted EBITDA from continuing
operations”) because our management believes that adjusted EBITDA from continuing operations provides
additional information to users of the financial statements regarding our ability to service, incur or pay down
indebtedness. In addition, management uses adjusted EBITDA from continuing operations to internally evaluate
performance and manage operations. Because adjusted EBITDA calculations may vary among other companies,
the adjusted EBITDA from continuing operations figures presented herein may not be comparable with similarly
titled measures of other companies. Adjusted EBITDA from continuing operations is not meant to be considered
in isolation or as a substitute for U.S. GAAP financial measures.
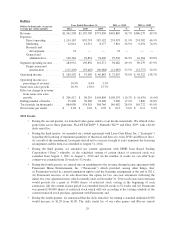
A reconciliation of adjusted EBITDA from continuing operations to income from continuing operations, the most
comparable GAAP financial measure, is presented below:
Dollars in thousands Year Ended December 31, 2011 vs. 2010 2010 vs. 2009
2011 2010 2009 $ % $ %
Income from continuing
operations .................... $114,951 $ 65,894 $ 43,693 $ 49,057 74.4% $22,201 50.8%
Depreciation, amortization and
other .................... 148,218 126,992 89,981 21,226 16.7% 37,011 41.1%
Interest expense, net .......... 23,822 34,705 34,248 (10,883) (31.4)% 457 1.3%
Income taxes ............... 69,777 43,032 25,720 26,745 62.2% 17,312 67.3%
Share-based payments
expense(1) ................. 16,211 16,016 8,816 195 1.2% 7,200 81.7%
Early retirement of debt ....... — — 1,082 — — (1,082) (100.0)%
Adjusted EBITDA from
continuing operations . . . $372,979 $286,639 $203,540 $ 86,340 30.1% $83,099 40.8%
(1) Includes both non-cash share-based compensation for executives, non-employee directors and employees as
well as share-based payments for content arrangements.
The increases in our adjusted EBITDA from continuing operations during both 2011 and 2010 were primarily
due to improvements in the results of our Redbox segment. The other components of adjusted EBITDA have
been discussed previously in the results of operations section above.
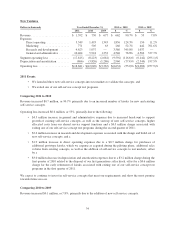
Free Cash Flow from Continuing Operations
From time to time, we use the non-GAAP financial measure free cash flow from continuing operations (“FCF”).
The difference between FCF from continuing operations and net cash provided by operating activities, which is
the most comparable GAAP financial measure, is that FCF from continuing operations reflects the impact of
capital expenditures. Our management believes that FCF from continuing operations provides additional
information to users of the financial statements regarding our ability to service, incur or pay down indebtedness
and repurchase our common stock. FCF from continuing operations is not meant to be considered in isolation or
as a substitute for U.S. GAAP financial measures. The table below provides a reconciliation of net cash flows
from operating activities from continuing operations, to FCF from continuing operations:
Dollars in thousands Year Ended December 31, 2011 vs. 2010 2010 vs. 2009
2011 2010 2009 $ % $ %
Net cash provided by operating
activities ................... $406,516 $ 315,619 $ 123,890 $90,897 28.8% $191,729 154.8%
Purchase of property and
equipment .................. (179,236) (170,847) (148,467) (8,389) 4.9% (22,380) 15.1%
FCF ..................... $227,280 $ 144,772 $ (24,577) $82,508 57.0% $169,349 (689.1)%
37