Redbox 2011 Annual Report Download - page 81
Download and view the complete annual report
Please find page 81 of the 2011 Redbox annual report below. You can navigate through the pages in the report by either clicking on the pages listed below, or by using the keyword search tool below to find specific information within the annual report.-
 1
1 -
2
-
3
-
4
-
5
-
6
-
7
-
8
-
9
-
10
-
11
-
12
-
13
-
14
-
15
-
16
-
17
-
18
-
19
-
20
-
21
-
22
-
23
-
24
-
25
-
26
-
27
-
28
-
29
-
30
-
31
-
32
-
33
-
34
-
35
-
36
-
37
-
38
-
39
-
40
-
41
-
42
-
43
-
44
-
45
-
46
-
47
-
48
-
49
-
50
-
51
-
52
-
53
-
54
-
55
-
56
-
57
-
58
-
59
-
60
-
61
-
62
-
63
-
64
-
65
-
66
-
67
-
68
-
69
-
70
-
 71
71 -
 72
72 -
 73
73 -
 74
74 -
 75
75 -
 76
76 -
 77
77 -
 78
78 -
 79
79 -
 80
80 -
 81
81 -
 82
82 -
 83
83 -
 84
84 -
 85
85 -
 86
86 -
 87
87 -
 88
88 -
 89
89 -
 90
90 -
 91
91 -
92
-
93
-
94
-
95
-
96
-
97
-
98
-
99
-
100
-
101
-
102
-
103
-
104
-
105
-
106
 |
 |

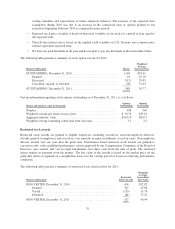
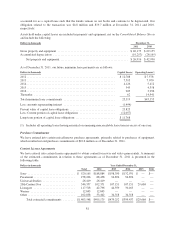
Tax Years Open for Examination
For our major tax jurisdictions, the following years were open for examination by US federal and state tax
authorities:
Jurisdiction
As of December 31, 2011
Open Tax Years
U.S. 2002 through 2010
Deferred Income Taxes
Deferred income tax assets and liabilities reflect the net tax effects of temporary differences between the carrying
amounts of assets and liabilities for financial reporting purposes and the carrying amounts used for income tax
purposes. Future tax benefits for net operating loss and tax credit carryforwards are also recognized to the extent
that realization of such benefits is more likely than not.
In determining our tax provisions, management determined the deferred tax assets and liabilities for each
separate tax jurisdiction and considered a number of factors including the positive and negative evidence
regarding the realization of our deferred tax assets to determine whether a valuation allowance should be
recognized with respect to our deferred tax assets. As of December 31, 2011, a valuation allowance was not
necessary as positive evidence outweighed negative evidence that those deferred tax assets were more likely than
not be realized.
Significant components of our deferred tax assets and liabilities and the net increase (decrease) in the valuation
allowance were as follows:
Dollars in thousands December 31,
2011 2010
Deferred tax assets:
Tax loss carryforwards ............................... $ 82,119 $ 98,137
Credit carryforwards ................................ 6,372 4,907
Accrued liabilities and allowances ..................... 14,681 13,330
Stock-based compensation ............................ 7,953 5,416
Intangible assets .................................... 42,618 46,141
Other ............................................ — 4,989
Gross deferred tax assets ................................. 153,743 172,920
Less: valuation allowance ............................ — (8,947)
Total deferred tax assets ................................. 153,743 163,973
Deferred tax liabilities:
Property and equipment .............................. (118,890) (80,331)
Convertible debt interest ............................. (7,783) (10,317)
Other ............................................ (12,922) —
Total deferred tax liabilities ............................... (139,595) (90,648)
Net deferred tax assets ................................... $ 14,148 $ 73,325
Change in Valuation Allowance
Dollars in thousands Year Ended December 31,
2011 2010 2009
(Decrease) increase in valuation allowance ............... $(8,947) $(982) $3,032
73