Redbox 2011 Annual Report Download - page 39
Download and view the complete annual report
Please find page 39 of the 2011 Redbox annual report below. You can navigate through the pages in the report by either clicking on the pages listed below, or by using the keyword search tool below to find specific information within the annual report.-
 1
1 -
2
-
3
-
4
-
5
-
6
-
7
-
8
-
9
-
10
-
11
-
12
-
13
-
14
-
15
-
16
-
17
-
18
-
19
-
20
-
21
-
22
-
23
-
24
-
25
-
26
-
27
-
28
-
 29
29 -
 30
30 -
 31
31 -
 32
32 -
 33
33 -
 34
34 -
 35
35 -
 36
36 -
 37
37 -
 38
38 -
 39
39 -
 40
40 -
 41
41 -
 42
42 -
 43
43 -
 44
44 -
 45
45 -
 46
46 -
 47
47 -
 48
48 -
 49
49 -
50
-
51
-
52
-
53
-
54
-
55
-
56
-
57
-
58
-
59
-
60
-
61
-
62
-
63
-
64
-
65
-
66
-
67
-
68
-
69
-
70
-
71
-
72
-
73
-
74
-
75
-
76
-
77
-
78
-
79
-
80
-
81
-
82
-
83
-
84
-
85
-
86
-
87
-
88
-
89
-
90
-
91
-
92
-
93
-
94
-
95
-
96
-
97
-
98
-
99
-
100
-
101
-
102
-
103
-
104
-
105
-
106
 |
 |
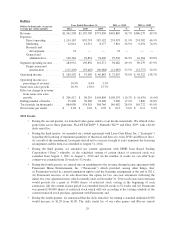
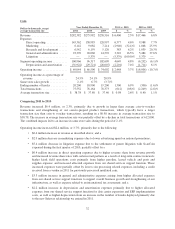
Operating income increased $56.5 million, or 138.3%, primarily due to the following:
• $386.3 million increase in revenue as described above; partially offset by a
• $274.6 million increase in direct operating expenses attributable to the revenue growth, which was
primarily due to higher DVD and game product costs, revenue share and payment card processing fees
and increased kiosk field operations expenses, as well as increased restricted stock expense due to a
higher market price of our common stock on the last day of the period when compared to the prior
period. As our installed kiosk base continues to increase, we are able to better utilize our existing field
resources and lower the servicing costs per kiosk. As a percent of revenue, direct operating expenses
decreased 1.6 percentage points to 74.1% in 2010 from 75.7% in 2009;
• $32.8 million increase in depreciation and amortization expenses due to growth in the installed kiosk
base, as well as the continued build-out of our technology infrastructure. In addition, in 2010, there was
$5.5 million in accelerated depreciation related to the 2010 closure of DVDXpress branded kiosks;
• $16.4 million increase in general and administrative expenses related primarily to new hires, mainly in
the information technology, software development, customer experience and marketing areas, as well
as professional consulting services supporting overall business growth and strengthening of our
infrastructure. We continue to leverage our general and administrative expenses as they decreased as a
percent of revenue 1.9 percentage points from 10.1% in 2009 to 8.2% in 2010; and a
• $6.1 million increase in marketing expenses due to certain national marketing programs, including
radio advertising, search engine marketing, and social media outlets, which began in the second quarter
of 2010, as well as affiliate programs and promotional email.
31