Redbox 2011 Annual Report Download - page 80
Download and view the complete annual report
Please find page 80 of the 2011 Redbox annual report below. You can navigate through the pages in the report by either clicking on the pages listed below, or by using the keyword search tool below to find specific information within the annual report.-
 1
1 -
2
-
3
-
4
-
5
-
6
-
7
-
8
-
9
-
10
-
11
-
12
-
13
-
14
-
15
-
16
-
17
-
18
-
19
-
20
-
21
-
22
-
23
-
24
-
25
-
26
-
27
-
28
-
29
-
30
-
31
-
32
-
33
-
34
-
35
-
36
-
37
-
38
-
39
-
40
-
41
-
42
-
43
-
44
-
45
-
46
-
47
-
48
-
49
-
50
-
51
-
52
-
53
-
54
-
55
-
56
-
57
-
58
-
59
-
60
-
61
-
62
-
63
-
64
-
65
-
66
-
67
-
68
-
69
-
 70
70 -
 71
71 -
 72
72 -
 73
73 -
 74
74 -
 75
75 -
 76
76 -
 77
77 -
 78
78 -
 79
79 -
 80
80 -
 81
81 -
 82
82 -
 83
83 -
 84
84 -
 85
85 -
 86
86 -
 87
87 -
 88
88 -
 89
89 -
 90
90 -
91
-
92
-
93
-
94
-
95
-
96
-
97
-
98
-
99
-
100
-
101
-
102
-
103
-
104
-
105
-
106
 |
 |

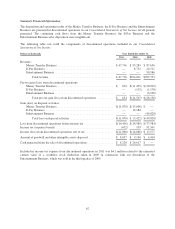
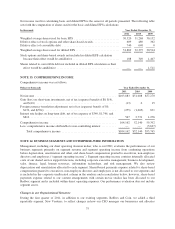
Components of Income Tax Expense
The components of income tax expense were as follows:
Dollars in thousands Year Ended December 31,
2011 2010 2009
Current:
U.S. Federal ................................................ $ — $ — $ 8,305
State and local ............................................... 9,326 1,003 1,511
Foreign .................................................... 375 634 1,222
Total current .................................................... 9,701 1,637 11,038
Deferred:
U.S. Federal ................................................ 58,858 36,957 12,581
State and local ............................................... 580 4,703 2,738
Foreign .................................................... 638 (265) (637)
Total deferred ................................................... 60,076 41,395 14,682
Total income tax expense .......................................... $69,777 $43,032 $25,720
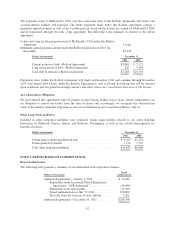
Rate Reconciliation
The income tax expense differs from the amount that would result by applying the U.S. statutory rate to income
before income taxes as follows:
Year Ended December 31,
2011 2010 2009
U.S Federal tax expense at statutory rates ............................. 35.0% 35.0% 35.0%
State income taxes, net of federal benefit .......................... 4.3% 3.5% 3.8%
Non-controlling interest ....................................... — — (1.8)%
Federal and state credits ....................................... (0.6)% — —
Other ...................................................... (0.9)% 1.0% 0.1%
Effective tax rate ................................................. 37.8% 39.5% 37.1%
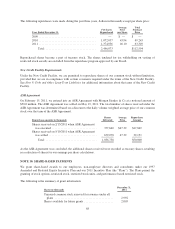
Unrecognized Tax Benefits
The aggregate changes in the balance of unrecognized tax benefits were as follows:
Dollars in thousands Year ended December 31,
2011 2010 2009
Balance, beginning of the year ...................................... $1,821 $1,800 $1,200
Additions based on tax positions related to the current year ........... 315 70 100
Additions for tax positions related to prior years .................... 420 — 500
Reductions for tax positions related to prior years ................... — (39) —
Reductions from lapse of applicable statute of limitations ............. — (10) —
Settlements ................................................. (101) — —
Balance, end of year .............................................. $2,455 $1,821 $1,800
At December 31, 2011, the unrecognized tax benefits were primarily related to R&D credit and income/expense
recognition, all of which would have an effect on our effective tax rate if recognized. It was not necessary to
accrue interest and penalties associated with the uncertain tax positions identified because operating losses and
tax credit carryforwards were sufficient to offset all unrecognized tax benefits.
72