Redbox 2011 Annual Report Download - page 42
Download and view the complete annual report
Please find page 42 of the 2011 Redbox annual report below. You can navigate through the pages in the report by either clicking on the pages listed below, or by using the keyword search tool below to find specific information within the annual report.
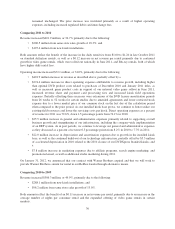
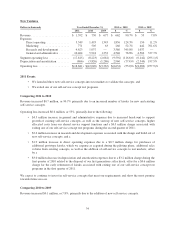
New Ventures
Dollars in thousands Year Ended December 31, 2011 vs. 2010 2010 vs. 2009
2011 2010 2009 $ % $ %
Revenue .......................... $ 1,392 $ 730 $ 677 $ 662 90.7% $ 53 7.8%
Expenses:
Direct operating ............... 3,349 1,493 1,343 1,856 124.3% 150 11.2%
Marketing .................... 771 505 63 266 52.7% 442 701.6%
Research and development ....... 4,623 1,037 — 3,586 345.8% 1,037 —
General and administrative ....... 10,464 5,918 1,352 4,546 76.8% 4,566 337.7%
Segment operating loss .............. (17,815) (8,223) (2,081) (9,592) (116.6)% (6,142) (295.1)%
Depreciation and amortization ........ (866) (3,826) (1,286) 2,960 (77.4)% (2,540) 197.5%
Operating loss ..................... $(18,681) $(12,049) $(3,367) $(6,632) (55.0)% $(8,682) (257.9)%
2011 Events
• We launched three new self-service concepts into test markets to validate the concepts; and
• We exited one of our self-service concept test programs.
Comparing 2011 to 2010
Revenue increased $0.7 million, or 90.7% primarily due to an increased number of kiosks for new and existing
self-service concepts.
Operating loss increased $6.6 million, or 55%, primarily due to the following:
• $4.5 million increase in general and administrative expenses due to increased headcount to support
growth of existing self-service concepts, as well as the start-up of new self-service concepts, higher
allocated costs from our shared service support functions and a $0.5 million charge associated with
exiting one of our self-service concept test programs during the second quarter of 2011;
• $3.6 million increase in research and development expenses associated with the design and build out of
new self-service concepts; and a
• $1.9 million increase in direct operating expenses due to a $0.7 million charge for purchases of
additional prototype kiosks, which we expense as acquired during the piloting phase, additional sales
volume from existing concepts, as well as the addition of self-service concepts to test markets; offset
by a
• $3.0 million decrease in depreciation and amortization expenses due to a $3.2 million charge during the
first quarter of 2010 related to the disposal of our first generation coffee kiosk, offset by a $0.6 million
charge for the early retirement of kiosks associated with exiting one of our self-service concept test
programs in the first quarter of 2011.
We expect to continue to invest in self-service concepts that meet our requirements and show the most promise
towards future success.
Comparing 2010 to 2009
Revenue increased $0.1 million, or 7.8%, primarily due to the addition of new self-service concepts.
34


