Redbox 2011 Annual Report Download - page 83
Download and view the complete annual report
Please find page 83 of the 2011 Redbox annual report below. You can navigate through the pages in the report by either clicking on the pages listed below, or by using the keyword search tool below to find specific information within the annual report.
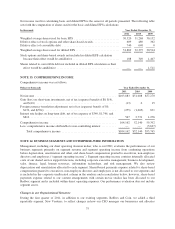
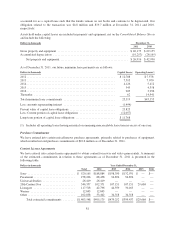
Net income used for calculating basic and diluted EPS is the same for all periods presented. The following table
sets forth the computation of shares used for the basic and diluted EPS calculations:
In thousands Year Ended December 31,
2011 2010 2009
Weighted average shares used for basic EPS ............................... 30,520 31,268 30,152
Dilutive effect of stock options and other share-based awards .................. 609 489 362
Dilutive effect of convertible debt ....................................... 740 640 0
Weighted average shares used for diluted EPS .............................. 31,869 32,397 30,514
Stock options and share-based awards not included in diluted EPS calculation
because their effect would be antidilutive ................................ 108 349 1,407
Shares related to convertible debt not included in diluted EPS calculation as their
effect would be antidilutive ........................................... — — 1,511
NOTE 13: COMPREHENSIVE INCOME
Comprehensive income was as follows:
Dollars in thousands Year Ended December 31,
2011 2010 2009
Net income ....................................................... $103,883 $51,008 $57,270
Gain (loss) on short-term investments, net of tax (expense) benefit of $8, $(4),
and $(10) ...................................................... (13) 6 15
Foreign currency translation adjustment, net of tax (expense) benefit of $0,
$132, and $(394) ................................................ (255) (1,605) 831
Interest rate hedges on long-term debt, net of tax expense of $349, $1,746, and
$816 .......................................................... 547 2,731 1,276
Comprehensive income ............................................. 104,162 52,140 59,392
Less: comprehensive income attributable to non-controlling interest .......... — — (3,627)
Total comprehensive income ..................................... $104,162 $52,140 $55,765
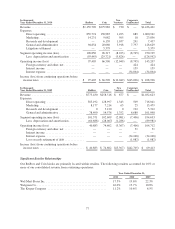
NOTE 14: BUSINESS SEGMENTS AND ENTERPRISE-WIDE INFORMATION
Management, including our chief operating decision maker, who is our CEO, evaluates the performances of our
business segments primarily on segment revenue and segment operating income from continuing operations
before depreciation, amortization and other, and share-based compensation granted to executives, non-employee
directors and employees (“segment operating income”). Segment operating income contains internally allocated
costs of our shared service support functions, including corporate executive management, business development,
sales, finance, legal, human resources, information technology, and risk management. We also review
depreciation and amortization allocated to each segment. Shared-based payments expense related to share-based
compensation granted to executives, non-employee directors and employees is not allocated to our segments and
is included in the corporate unallocated column in the analysis and reconciliation below; however, share-based
payments expense related to our content arrangements with certain movie studios has been allocated to our
Redbox segment and is included within direct operating expenses. Our performance evaluation does not include
segment assets.
Changes in our Organizational Structure
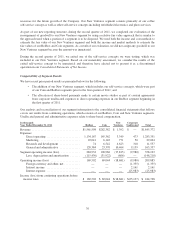
During the first quarter of 2011, in addition to our existing segments, Redbox and Coin, we added a third
reportable segment, New Ventures, to reflect changes in how our CEO manages our businesses and allocates
75


