Redbox 2011 Annual Report Download - page 34
Download and view the complete annual report
Please find page 34 of the 2011 Redbox annual report below. You can navigate through the pages in the report by either clicking on the pages listed below, or by using the keyword search tool below to find specific information within the annual report.-
 1
1 -
2
-
3
-
4
-
5
-
6
-
7
-
8
-
9
-
10
-
11
-
12
-
13
-
14
-
15
-
16
-
17
-
18
-
19
-
20
-
21
-
22
-
23
-
 24
24 -
 25
25 -
 26
26 -
 27
27 -
 28
28 -
 29
29 -
 30
30 -
 31
31 -
 32
32 -
 33
33 -
 34
34 -
 35
35 -
 36
36 -
 37
37 -
 38
38 -
 39
39 -
 40
40 -
 41
41 -
 42
42 -
 43
43 -
 44
44 -
45
-
46
-
47
-
48
-
49
-
50
-
51
-
52
-
53
-
54
-
55
-
56
-
57
-
58
-
59
-
60
-
61
-
62
-
63
-
64
-
65
-
66
-
67
-
68
-
69
-
70
-
71
-
72
-
73
-
74
-
75
-
76
-
77
-
78
-
79
-
80
-
81
-
82
-
83
-
84
-
85
-
86
-
87
-
88
-
89
-
90
-
91
-
92
-
93
-
94
-
95
-
96
-
97
-
98
-
99
-
100
-
101
-
102
-
103
-
104
-
105
-
106
 |
 |
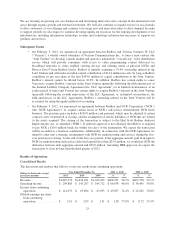
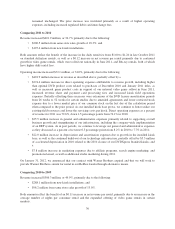
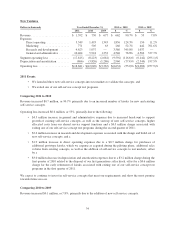
2011 Events
During the second quarter of 2011, we completed the sale of our Money Transfer Business to Sigue Corporation
for $19.5 million in cash and a note receivable of $29.5 million. For additional information about the sale see
Note 4: Discontinued Operations, Sale of Assets of Businesses and Assets Held for Sale in our Notes to
Consolidated Financial Statements.
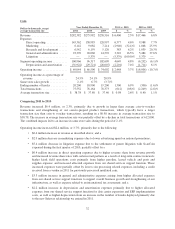
Comparing 2011 to 2010
Revenue increased $409.0 million, or 28.5%, primarily due to new kiosk installations and same store sales
growth in our Redbox segment.
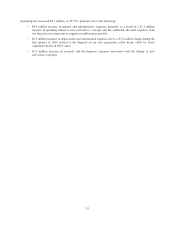
Operating income increased $66.7 million, or 46.6%, primarily due to our Redbox segment, where revenue
growth was partially offset by increased content costs, revenue share and processing fees and general and
administrative expenses as a result of overall business growth and implementation of a company-wide Enterprise
Resource Planning (“ERP”) system.
Income from continuing operations increased $49.1 million, or 74.4%, primarily due to the following:
• Higher operating income in our Redbox segment; and
• Decreased interest expense related to principal payments made on our revolving credit facility and the
expiration of our interest rate swap agreement; partially offset by
• Increased income tax expense primarily due to higher pretax income, partially offset by a lower
effective tax rate.
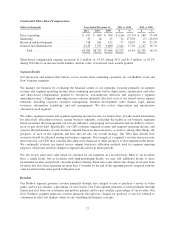
Comparing 2010 to 2009
Revenue increased $403.8 million, or 39.1%, primarily due to new kiosk installations and same store sales
growth in our Redbox segment.
Operating income increased $38.5 million, or 36.8% primarily due to our Redbox segment where revenue growth
was partially offset by increased content costs and depreciation expense from new kiosk installations. The
increase in our Redbox segment was partially offset by a decline in operating income in our Coin segment.
Income from continuing operations increased $22.2 million, or 50.8%, primarily due to the following:
• Higher operating income in our Redbox segment; partially offset by
• Lower operating income in our Coin segment; and
• A higher effective income tax rate.
For additional information about our consolidated results refer to our Segment Results in this Management’s
Discussion and Analysis of Financial Condition and Results of Operations.
Share-Based Payments
Our share-based payments consist of share-based compensation granted to executives, non-employee directors
and employees and share-based payments granted to movie studios as part of content agreements. We grant stock
options, restricted stock and performance-based restricted stock to executives and non-employee directors and
grant restricted stock to our employees. We also granted restricted stock to certain movie studios as part of
content agreements with our Redbox segment. The expense associated with the grants to movie studios is
allocated to our Redbox segment and included within direct operating expenses. The expense associated with
share-based compensation to our executives, non-employee directors and employees is part of our shared service
support function and is not allocated to our segments. The components of our unallocated share-based
compensation expense are presented in the following table.
26