Redbox 2011 Annual Report Download - page 43
Download and view the complete annual report
Please find page 43 of the 2011 Redbox annual report below. You can navigate through the pages in the report by either clicking on the pages listed below, or by using the keyword search tool below to find specific information within the annual report.-
 1
1 -
2
-
3
-
4
-
5
-
6
-
7
-
8
-
9
-
10
-
11
-
12
-
13
-
14
-
15
-
16
-
17
-
18
-
19
-
20
-
21
-
22
-
23
-
24
-
25
-
26
-
27
-
28
-
29
-
30
-
31
-
32
-
 33
33 -
 34
34 -
 35
35 -
 36
36 -
 37
37 -
 38
38 -
 39
39 -
 40
40 -
 41
41 -
 42
42 -
 43
43 -
 44
44 -
 45
45 -
 46
46 -
 47
47 -
 48
48 -
 49
49 -
 50
50 -
 51
51 -
 52
52 -
 53
53 -
54
-
55
-
56
-
57
-
58
-
59
-
60
-
61
-
62
-
63
-
64
-
65
-
66
-
67
-
68
-
69
-
70
-
71
-
72
-
73
-
74
-
75
-
76
-
77
-
78
-
79
-
80
-
81
-
82
-
83
-
84
-
85
-
86
-
87
-
88
-
89
-
90
-
91
-
92
-
93
-
94
-
95
-
96
-
97
-
98
-
99
-
100
-
101
-
102
-
103
-
104
-
105
-
106
 |
 |
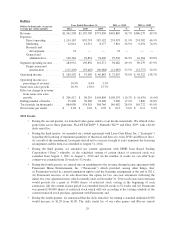
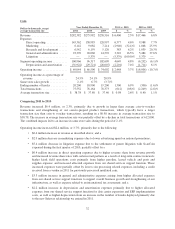
Operating loss increased $8.7 million, or 257.9%, primarily due to the following:
• $4.6 million increase in general and administrative expenses primarily as a result of a $2.1 million
increase in spending related to new self-service concepts and the additional allocated expenses from
our shared service functions to support overall business growth;
• $2.5 million increase in depreciation and amortization expenses due to a $3.2 million charge during the
first quarter of 2010 related to the disposal of our first generation coffee kiosk, offset by fewer
capitalized kiosks in 2010; and a
• $1.0 million increase in research and development expenses associated with the design of new
self-service concepts.
35