Redbox 2011 Annual Report Download - page 52
Download and view the complete annual report
Please find page 52 of the 2011 Redbox annual report below. You can navigate through the pages in the report by either clicking on the pages listed below, or by using the keyword search tool below to find specific information within the annual report.-
 1
1 -
2
-
3
-
4
-
5
-
6
-
7
-
8
-
9
-
10
-
11
-
12
-
13
-
14
-
15
-
16
-
17
-
18
-
19
-
20
-
21
-
22
-
23
-
24
-
25
-
26
-
27
-
28
-
29
-
30
-
31
-
32
-
33
-
34
-
35
-
36
-
37
-
38
-
39
-
40
-
41
-
 42
42 -
 43
43 -
 44
44 -
 45
45 -
 46
46 -
 47
47 -
 48
48 -
 49
49 -
 50
50 -
 51
51 -
 52
52 -
 53
53 -
 54
54 -
 55
55 -
 56
56 -
 57
57 -
 58
58 -
 59
59 -
 60
60 -
 61
61 -
 62
62 -
63
-
64
-
65
-
66
-
67
-
68
-
69
-
70
-
71
-
72
-
73
-
74
-
75
-
76
-
77
-
78
-
79
-
80
-
81
-
82
-
83
-
84
-
85
-
86
-
87
-
88
-
89
-
90
-
91
-
92
-
93
-
94
-
95
-
96
-
97
-
98
-
99
-
100
-
101
-
102
-
103
-
104
-
105
-
106
 |
 |

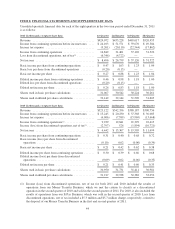
ITEM 8. FINANCIAL STATEMENTS AND SUPPLEMENTARY DATA
Unaudited quarterly financial data for each of the eight quarters in the two-year period ended December 31, 2011
is as follows:
2011 (In thousands, except per share data) 1st Quarter 2nd Quarter 3rd Quarter 4th Quarter
Revenue .......................................... $424,072 $435,228 $465,617 $520,455
Income from continuing operations before income taxes .... $ 24,103 $ 51,571 $ 59,670 $ 49,384
Income tax expense ................................. (9,261) (20,110) (22,544) (17,862)
Income from continuing operations ..................... 14,842 31,461 37,126 31,522
Loss from discontinued operations, net of tax(1) ............ (6,346) (4,722) — —
Net income ........................................ $ 8,496 $ 26,739 $ 37,126 $ 31,522
Basic income per share from continuing operations ........ $ 0.47 $ 1.03 $ 1.23 $ 1.04
Basic loss per share from discontinued operations ......... (0.20) (0.15) — —
Basic net income per share ............................ $ 0.27 $ 0.88 $ 1.23 $ 1.04
Diluted income per share from continuing operations ....... $ 0.46 $ 0.98 $ 1.18 $ 1.00
Diluted loss per share from discontinued operations ........ (0.20) (0.15) — —
Diluted net income per share .......................... $ 0.26 $ 0.83 $ 1.18 $ 1.00
Shares used in basic per share calculations ............... 31,067 30,542 30,224 30,261
Shares used in diluted per share calculations .............. 32,142 32,144 31,596 31,605
2010 (In thousands, except per share data) 1st Quarter 2nd Quarter 3rd Quarter 4th Quarter
Revenue .......................................... $323,122 $342,356 $380,187 $390,756
Income from continuing operations before income taxes .... $ 15,245 $ 20,230 $ 37,368 $ 36,083
Income tax expense ................................. (6,006) (7,389) (15,969) (13,668)
Income from continuing operations(2) .................... 9,239 12,841 21,399 22,415
Income (loss) from discontinued operations, net of tax(1) ..... (2,797) 526 (1,894) (10,721)
Net income ........................................ $ 6,442 $ 13,367 $ 19,505 $ 11,694
Basic income per share from continuing operations ........ $ 0.31 $ 0.40 $ 0.68 $ 0.72
Basic income (loss) per share from discontinued
operations ....................................... (0.10) 0.02 (0.06) (0.34)
Basic net income per share ............................ $ 0.21 $ 0.42 $ 0.62 $ 0.38
Diluted income per share from continuing operations ....... $ 0.30 $ 0.39 $ 0.66 $ 0.68
Diluted income (loss) per share from discontinued
operations ....................................... (0.09) 0.02 (0.06) (0.33)
Diluted net income per share .......................... $ 0.21 $ 0.41 $ 0.60 $ 0.35
Shares used in basic per share calculations ............... 30,950 31,731 31,411 30,981
Shares used in diluted per share calculations .............. 31,217 32,938 32,382 33,052
(1) Income (loss) from discontinued operations, net of tax for both 2011 and 2010 included the results of
operations from our Money Transfer Business, which we met the criteria to classify as a discontinued
operation in the second quarter of 2010 and sold in the second quarter of 2011. For 2010, it also included the
results of operations from our E-Pay Business, which was sold in the second quarter of 2010. Loss from
discontinued operations, net of tax included a $5.3 million and $5.7 million charge, respectively, related to
the disposal of our Money Transfer Business in the first and second quarters of 2011.
44