Redbox 2011 Annual Report Download - page 57
Download and view the complete annual report
Please find page 57 of the 2011 Redbox annual report below. You can navigate through the pages in the report by either clicking on the pages listed below, or by using the keyword search tool below to find specific information within the annual report.-
 1
1 -
2
-
3
-
4
-
5
-
6
-
7
-
8
-
9
-
10
-
11
-
12
-
13
-
14
-
15
-
16
-
17
-
18
-
19
-
20
-
21
-
22
-
23
-
24
-
25
-
26
-
27
-
28
-
29
-
30
-
31
-
32
-
33
-
34
-
35
-
36
-
37
-
38
-
39
-
40
-
41
-
42
-
43
-
44
-
45
-
46
-
 47
47 -
 48
48 -
 49
49 -
 50
50 -
 51
51 -
 52
52 -
 53
53 -
 54
54 -
 55
55 -
 56
56 -
 57
57 -
 58
58 -
 59
59 -
 60
60 -
 61
61 -
 62
62 -
 63
63 -
 64
64 -
 65
65 -
 66
66 -
 67
67 -
68
-
69
-
70
-
71
-
72
-
73
-
74
-
75
-
76
-
77
-
78
-
79
-
80
-
81
-
82
-
83
-
84
-
85
-
86
-
87
-
88
-
89
-
90
-
91
-
92
-
93
-
94
-
95
-
96
-
97
-
98
-
99
-
100
-
101
-
102
-
103
-
104
-
105
-
106
 |
 |

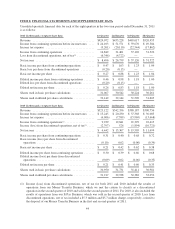
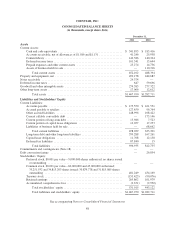
COINSTAR, INC.
CONSOLIDATED STATEMENTS OF NET INCOME
(in thousands, except per share data)
Year Ended December 31,
2011 2010 2009
Revenue .................................................. $1,845,372 $1,436,421 $1,032,623
Expenses:
Direct operating(1) ....................................... 1,283,351 1,000,941 716,041
Marketing ............................................. 29,004 23,836 15,479
Research and development ................................ 11,557 7,437 5,312
General and administrative ............................... 163,357 128,629 101,098
Depreciation and other (2) ................................. 145,478 123,687 86,418
Amortization of intangible assets ........................... 2,740 3,305 3,563
Litigation settlement ..................................... — 5,379 —
Total expenses ............................................. 1,635,487 1,293,214 927,911
Operating income ........................................... 209,885 143,207 104,712
Other income (expense):
Foreign currency and other, net ............................ (1,335) 424 31
Interest income ......................................... 2,161 159 —
Interest expense ........................................ (25,983) (34,864) (34,248)
Early retirement of debt .................................. — — (1,082)
Total other income (expense) .................................. (25,157) (34,281) (35,299)
Income from continuing operations before income taxes ............ 184,728 108,926 69,413
Income tax expense ......................................... (69,777) (43,032) (25,720)
Income from continuing operations ............................. 114,951 65,894 43,693
Income (loss) from discontinued operations, net of tax .............. (11,068) (14,886) 13,577
Net income ................................................ 103,883 51,008 57,270
Net income attributable to non-controlling interests ................ — — (3,627)
Net income attributable to Coinstar, Inc. ......................... $ 103,883 $ 51,008 $ 53,643
Basic earnings (loss) per share attributable to Coinstar, Inc.:
Continuing operations ................................... $ 3.76 $ 2.11 $ 1.33
Discontinued operations .................................. (0.36) (0.48) 0.45
Basic earnings per share attributable to Coinstar, Inc. ............... $ 3.40 $ 1.63 $ 1.78
Diluted earnings (loss) per share attributable to Coinstar, Inc.:
Continuing operations ................................... $ 3.61 $ 2.03 $ 1.31
Discontinued operations .................................. (0.35) (0.46) 0.45
Diluted earnings per share attributable to Coinstar, Inc. ............. $ 3.26 $ 1.57 $ 1.76
Weighted average shares used in basic per share calculations ........ 30,520 31,268 30,152
Weighted average shares used in diluted per share calculations ....... 31,869 32,397 30,514
(1) “Direct operating” excludes depreciation and other of $121.2 million, $110.0 million, and $78.6 million for
2011, 2010, and 2009 respectively.
(2) “Depreciation and other” includes the write-down and acceleration of depreciation for certain revenue
generating kiosks in the amount of $9.5 million in 2010.
See accompanying Notes to Consolidated Financial Statements
49