Redbox 2011 Annual Report Download - page 41
Download and view the complete annual report
Please find page 41 of the 2011 Redbox annual report below. You can navigate through the pages in the report by either clicking on the pages listed below, or by using the keyword search tool below to find specific information within the annual report.-
 1
1 -
2
-
3
-
4
-
5
-
6
-
7
-
8
-
9
-
10
-
11
-
12
-
13
-
14
-
15
-
16
-
17
-
18
-
19
-
20
-
21
-
22
-
23
-
24
-
25
-
26
-
27
-
28
-
29
-
30
-
 31
31 -
 32
32 -
 33
33 -
 34
34 -
 35
35 -
 36
36 -
 37
37 -
 38
38 -
 39
39 -
 40
40 -
 41
41 -
 42
42 -
 43
43 -
 44
44 -
 45
45 -
 46
46 -
 47
47 -
 48
48 -
 49
49 -
 50
50 -
 51
51 -
52
-
53
-
54
-
55
-
56
-
57
-
58
-
59
-
60
-
61
-
62
-
63
-
64
-
65
-
66
-
67
-
68
-
69
-
70
-
71
-
72
-
73
-
74
-
75
-
76
-
77
-
78
-
79
-
80
-
81
-
82
-
83
-
84
-
85
-
86
-
87
-
88
-
89
-
90
-
91
-
92
-
93
-
94
-
95
-
96
-
97
-
98
-
99
-
100
-
101
-
102
-
103
-
104
-
105
-
106
 |
 |
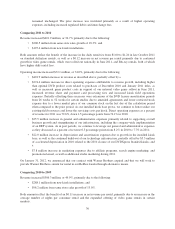
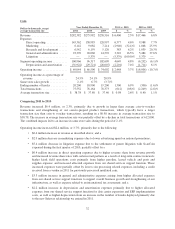
Comparing 2010 to 2009
Revenue increased $17.5 million, or 6.8%, primarily due to same store sales growth as a result of an increase in
our coin-counting transaction fee from 8.9% to 9.8% that took effect for most of our coin-counting kiosks in the
U.S. during the first quarter of 2010, as well as a $0.40 increase in average transaction size to $37.80, offset by a
2.2 million decrease in total transactions.
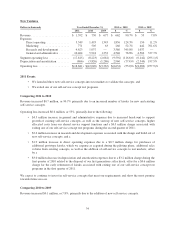
Operating income decreased $8.0 million, or 10.7%, primarily due to the following:
• $10.0 million increase in direct operating expenses from higher revenue share expense paid to our retail
partners as a result of the coin-counting fee increase and higher operating costs related to kiosk field
operations, bank fees and kiosk property tax expense;
• $5.5 million increase in general and administrative expenses primarily due to an increase in allocated
costs from our shared service support functions as a result of increased headcount and related costs, as
well as investment in infrastructure to support overall business growth which grew faster than the
related revenues;
• $5.4 million increase in litigation expense from the settlement of patent litigation with ScanCoin
expensed during the first quarter of 2010;
• $1.9 million increase in marketing expense from our launch of additional marketing programs,
including regional billboards, brand ID, and multiple media channels, to reengage our consumers
during 2010 and drive sustainable demand during 2011;
• $1.7 million increase in depreciation and amortization expenses primarily as a result of higher allocated
expenses from our shared service support function due to continued investment in our shared service
infrastructure; and a
• $1.0 million increase in research and development expense as a result of the expansion of our
development and design of complementary new product ideas and continued efforts to enhance our
existing products and services including a new user interface; partially offset by a
• $17.5 million increase in revenue as described above.
33