Redbox 2011 Annual Report Download - page 44
Download and view the complete annual report
Please find page 44 of the 2011 Redbox annual report below. You can navigate through the pages in the report by either clicking on the pages listed below, or by using the keyword search tool below to find specific information within the annual report.-
 1
1 -
2
-
3
-
4
-
5
-
6
-
7
-
8
-
9
-
10
-
11
-
12
-
13
-
14
-
15
-
16
-
17
-
18
-
19
-
20
-
21
-
22
-
23
-
24
-
25
-
26
-
27
-
28
-
29
-
30
-
31
-
32
-
33
-
 34
34 -
 35
35 -
 36
36 -
 37
37 -
 38
38 -
 39
39 -
 40
40 -
 41
41 -
 42
42 -
 43
43 -
 44
44 -
 45
45 -
 46
46 -
 47
47 -
 48
48 -
 49
49 -
 50
50 -
 51
51 -
 52
52 -
 53
53 -
 54
54 -
55
-
56
-
57
-
58
-
59
-
60
-
61
-
62
-
63
-
64
-
65
-
66
-
67
-
68
-
69
-
70
-
71
-
72
-
73
-
74
-
75
-
76
-
77
-
78
-
79
-
80
-
81
-
82
-
83
-
84
-
85
-
86
-
87
-
88
-
89
-
90
-
91
-
92
-
93
-
94
-
95
-
96
-
97
-
98
-
99
-
100
-
101
-
102
-
103
-
104
-
105
-
106
 |
 |

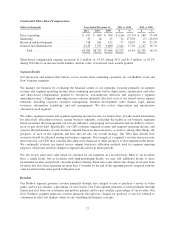
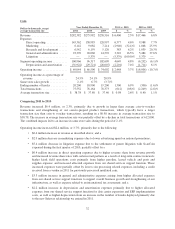
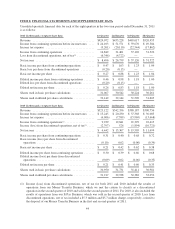
Interest Expense
Dollars in thousands Year Ended December 31, 2011 vs. 2010 2010 vs. 2009
2011 2010 2009 $ % $ %
Cash interest expense .................. $16,468 $26,278 $30,566 $(9,810) (37.3)% $(4,288) (14.0)%
Non-cash interest expense .............. 9,515 8,586 3,682 929 10.8% 4,904 133.2%
Total interest expense .............. $25,983 $34,864 $34,248 $(8,881) (25.5)% $ 616 1.8%
Comparing 2011 to 2010
Interest expense decreased $8.9 million, or 25.5%, primarily due to a lower average debt balance as a result of
net payments on our revolving credit facility, as well as the expiration of our interest rate swap in 2011; partially
offset by an increase in non-cash interest expense related to the amortization of our convertible debt discount.
Comparing 2010 to 2009
Interest expense increased $0.6 million, or 1.8%, primarily due to an increase in non-cash interest expense related
to the amortization of debt discount on our convertible debt, which was issued in September 2009, partially offset
by a lower average debt balance as we paid down our revolving credit facility by $75.0 million in August 2010.
Early Retirement of Debt
The $1.1 million charge for early retirement of debt in 2009 related to our early retirement of our $87.5 million
term loan in conjunction with the issuance of our $200.0 million convertible senior notes in September 2009.
Income Tax Expense
Our effective tax rate from continuing operations was 37.8%, 39.5% and 37.1% in 2011, 2010 and 2009,
respectively. Our tax rate is affected by recurring items, such as tax rates in foreign jurisdictions and the relative
amount of income we earn in jurisdictions, which we expect to be fairly consistent in the near term. It is also
affected by discrete items that may occur in any given year, but are not consistent from year to year. In addition
to state income taxes, the following items had the most significant impact on the difference between our statutory
U.S. federal income tax rate of 35% and our effective tax rate:
• The decrease in our effective tax rate from 2010 to 2011 was attributable primarily to higher levels of
federal and state research and general business credits and other discrete items; and
• The increase in our effective tax rate from 2009 to 2010 was primarily attributable to a decrease in our
non-controlling interest income after we purchased the remaining non-controlling interests in Redbox
in February 2009.
Non-Controlling Interests
Non-controlling interest of $3.6 million in 2009 represents the operating results, net of tax, for our 49.0% stake in
Redbox that we did not own prior to our purchase of the remaining non-controlling interests in February 2009.
Non-GAAP Financial Measures
Non-GAAP financial measures may be provided as a complement to results in accordance with United States
generally accepted accounting principles (“GAAP”). Non-GAAP measures are not a substitute for measures
computed in accordance with GAAP. Our non-GAAP measures may be different from the presentation of
financial information by other companies.
36