Quest Diagnostics 2013 Annual Report Download - page 97
Download and view the complete annual report
Please find page 97 of the 2013 Quest Diagnostics annual report below. You can navigate through the pages in the report by either clicking on the pages listed below, or by using the keyword search tool below to find specific information within the annual report.-
 1
1 -
2
-
3
-
4
-
5
-
6
-
7
-
8
-
9
-
10
-
11
-
12
-
13
-
14
-
15
-
16
-
17
-
18
-
19
-
20
-
21
-
22
-
23
-
24
-
25
-
26
-
27
-
28
-
29
-
30
-
31
-
32
-
33
-
34
-
35
-
36
-
37
-
38
-
39
-
40
-
41
-
42
-
43
-
44
-
45
-
46
-
47
-
48
-
49
-
50
-
51
-
52
-
53
-
54
-
55
-
56
-
57
-
58
-
59
-
60
-
61
-
62
-
63
-
64
-
65
-
66
-
67
-
68
-
69
-
70
-
71
-
72
-
73
-
74
-
75
-
76
-
77
-
78
-
79
-
80
-
81
-
82
-
83
-
84
-
85
-
86
-
 87
87 -
 88
88 -
 89
89 -
 90
90 -
 91
91 -
 92
92 -
 93
93 -
 94
94 -
 95
95 -
 96
96 -
 97
97 -
 98
98 -
 99
99 -
 100
100 -
 101
101 -
 102
102 -
 103
103 -
 104
104 -
 105
105 -
 106
106 -
 107
107 -
108
-
109
-
110
-
111
-
112
-
113
-
114
-
115
-
116
-
117
-
118
-
119
-
120
-
121
-
122
-
123
-
124
-
125
-
126
-
127
-
128
-
129
-
130
-
131
 |
 |

F- 25
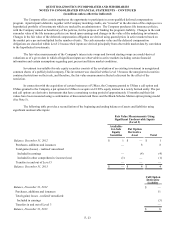
The components of income tax expense for 2013, 2012 and 2011 were as follows:
2013 2012 2011
Current:
Federal $ 417 $ 332 $ 266
State and local 59 61 60
Foreign 433
Deferred:
Federal 27 13 37
State and local (6)(6)(11)
Foreign (1)(1)—
Total $ 500 $ 402 $ 355
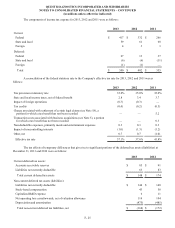
A reconciliation of the federal statutory rate to the Company's effective tax rate for 2013, 2012 and 2011 was as
follows:
2013 2012 2011
Tax provision at statutory rate 35.0% 35.0% 35.0%
State and local income taxes, net of federal benefit 2.8 3.4 3.7
Impact of foreign operations (0.3)(0.3)—
Tax credits (0.4)(0.2)(0.5)
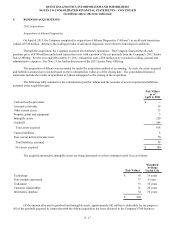
Charge associated with settlement of certain legal claims (see Note 18), a
portion for which a tax benefit has not been recorded — — 5.2
Transaction costs associated with business acquisitions (see Note 5), a portion
for which a tax benefit has not been recorded — — 0.3
Non-deductible expenses, primarily meals and entertainment expenses 0.3 0.3 0.3
Impact of noncontrolling interests (1.0)(1.3)(1.2)
Other, net 0.7 0.7 (1.0)
Effective tax rate 37.1% 37.6% 41.8%
The tax effects of temporary differences that give rise to significant portions of the deferred tax assets (liabilities) at
December 31, 2013 and 2012 were as follows:
2013 2012
Current deferred tax assets:
Accounts receivable reserves $ 85 $ 91
Liabilities not currently deductible 63 83
Total current deferred tax assets $ 148 $ 174
Non-current deferred tax assets (liabilities):
Liabilities not currently deductible $ 144 $ 140
Stock-based compensation 43 58
Capitalized R&D expense 611
Net operating loss carryforwards, net of valuation allowance 114 104
Depreciation and amortization (475)(485)
Total non-current deferred tax liabilities, net $ (168)$ (172)
QUEST DIAGNOSTICS INCORPORATED AND SUBSIDIARIES
NOTES TO CONSOLIDATED FINANCIAL STATEMENTS – CONTINUED
(in millions unless otherwise indicated)