Quest Diagnostics 2013 Annual Report Download - page 63
Download and view the complete annual report
Please find page 63 of the 2013 Quest Diagnostics annual report below. You can navigate through the pages in the report by either clicking on the pages listed below, or by using the keyword search tool below to find specific information within the annual report.-
 1
1 -
2
-
3
-
4
-
5
-
6
-
7
-
8
-
9
-
10
-
11
-
12
-
13
-
14
-
15
-
16
-
17
-
18
-
19
-
20
-
21
-
22
-
23
-
24
-
25
-
26
-
27
-
28
-
29
-
30
-
31
-
32
-
33
-
34
-
35
-
36
-
37
-
38
-
39
-
40
-
41
-
42
-
43
-
44
-
45
-
46
-
47
-
48
-
49
-
50
-
51
-
52
-
 53
53 -
 54
54 -
 55
55 -
 56
56 -
 57
57 -
 58
58 -
 59
59 -
 60
60 -
 61
61 -
 62
62 -
 63
63 -
 64
64 -
 65
65 -
 66
66 -
 67
67 -
 68
68 -
 69
69 -
 70
70 -
 71
71 -
 72
72 -
 73
73 -
74
-
75
-
76
-
77
-
78
-
79
-
80
-
81
-
82
-
83
-
84
-
85
-
86
-
87
-
88
-
89
-
90
-
91
-
92
-
93
-
94
-
95
-
96
-
97
-
98
-
99
-
100
-
101
-
102
-
103
-
104
-
105
-
106
-
107
-
108
-
109
-
110
-
111
-
112
-
113
-
114
-
115
-
116
-
117
-
118
-
119
-
120
-
121
-
122
-
123
-
124
-
125
-
126
-
127
-
128
-
129
-
130
-
131
 |
 |
59
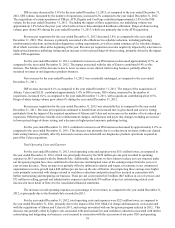
expenses associated with the acquired operations of Athena, Celera and S.E.D. Pre-tax restructuring and integration charges
totaled $106 million ($52 million in cost of services and $54 million in selling, general and administrative expenses) in 2012
and include $61 million of restructuring related costs discussed in more detail in Note 4 to the consolidated financial
statements. In addition, $10 million of pre-tax charges, associated with separation costs and accelerated vesting of certain
equity awards in connection with the succession of our prior CEO, were recorded in selling, general and administrative
expenses in 2012.
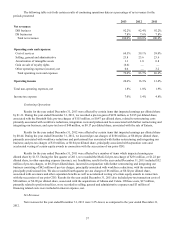
The decrease in total operating expenses as a percentage of net revenues compared to the prior year is principally due
to the Medi-Cal charge recorded in 2011.
Results for the year ended December 31, 2011 included the Medi-Cal pre-tax charge of $236 million recorded in
connection with the California Lawsuit. In addition, results for the year ended December 31, 2011 included $52 million of pre-
tax charges incurred in conjunction with further restructuring and integrating our business consisting of $42 million of pre-tax
charges, principally associated with workforce reductions, with the remainder principally professional fees. Of these costs, $22
million and $30 million were included in cost of services and selling, general and administrative expenses, respectively. In
addition, $6 million of pre-tax charges, associated with severance and other separation benefits as well as accelerated vesting of
certain equity awards in connection with the succession of our prior CEO, were recorded in selling, general and administrative
expenses in the fourth quarter of 2011. Selling, general and administrative expenses for the year ended December 31, 2011 also
included $17 million of pre-tax transaction costs, primarily related to professional fees associated with the acquisitions of
Athena and Celera.
Cost of Services
Cost of services consists principally of costs for obtaining, transporting and testing specimens.
The decrease in cost of services for the year ended December 31, 2013, as compared to the year ended December 31,
2012, is primarily due to the impact of actions we have taken to reduce our cost structure under the Invigorate program and
lower performance-based compensation, partially offset by increased costs related to our recent acquisitions.
The increase in cost of services as a percentage of net revenues for the year ended December 31, 2013, as compared to
the year ended December 31, 2012, was primarily related to the decrease in net revenues in 2013.
Cost of services as a percentage of revenues for the year ended December 31, 2012 was essentially unchanged, as
compared to the year ended December 31, 2011. Restructuring and integration activities and higher costs associated with
employee compensation and benefits, which served to increase the percentage, were offset by actions we took to reduce our
cost structure under our Invigorate program.
Selling, General and Administrative Expenses
Selling, general and administrative expenses consist principally of the costs associated with our sales and marketing
efforts, billing operations, bad debt expense and general management and administrative support.
The decrease in selling, general and administrative expenses for the year ended December 31, 2013 is primarily due to
the impact of actions we have taken to reduce our cost structure under the Invigorate program and lower performance-based
compensation. This was partially offset by higher charges associated with restructuring and integration activities for the year
ended December 31, 2013, as compared to the year ended December 31, 2012,
The increase in selling, general and administrative expenses as a percentage of net revenues for the year ended
December 31, 2013, as compared to the year ended December 31, 2012, was primarily related to the decrease in net revenues in
2013.
Selling, general and administrative expenses as a percentage of net revenues for the year ended December 31, 2012
was essentially unchanged, as compared to the year ended December 31, 2011. Restructuring and integration activities,
investments we made in our commercial sales organization, costs incurred in connection with the succession of our prior CEO
and higher costs associated with employee compensation and benefits served to increase the percentage compared to the prior
year. This was offset by actions we took to reduce our cost structure under our Invigorate program and transaction costs
associated with the Athena and Celera acquisitions that were incurred during the 2011.