Quest Diagnostics 2013 Annual Report Download - page 65
Download and view the complete annual report
Please find page 65 of the 2013 Quest Diagnostics annual report below. You can navigate through the pages in the report by either clicking on the pages listed below, or by using the keyword search tool below to find specific information within the annual report.-
 1
1 -
2
-
3
-
4
-
5
-
6
-
7
-
8
-
9
-
10
-
11
-
12
-
13
-
14
-
15
-
16
-
17
-
18
-
19
-
20
-
21
-
22
-
23
-
24
-
25
-
26
-
27
-
28
-
29
-
30
-
31
-
32
-
33
-
34
-
35
-
36
-
37
-
38
-
39
-
40
-
41
-
42
-
43
-
44
-
45
-
46
-
47
-
48
-
49
-
50
-
51
-
52
-
53
-
54
-
 55
55 -
 56
56 -
 57
57 -
 58
58 -
 59
59 -
 60
60 -
 61
61 -
 62
62 -
 63
63 -
 64
64 -
 65
65 -
 66
66 -
 67
67 -
 68
68 -
 69
69 -
 70
70 -
 71
71 -
 72
72 -
 73
73 -
 74
74 -
 75
75 -
76
-
77
-
78
-
79
-
80
-
81
-
82
-
83
-
84
-
85
-
86
-
87
-
88
-
89
-
90
-
91
-
92
-
93
-
94
-
95
-
96
-
97
-
98
-
99
-
100
-
101
-
102
-
103
-
104
-
105
-
106
-
107
-
108
-
109
-
110
-
111
-
112
-
113
-
114
-
115
-
116
-
117
-
118
-
119
-
120
-
121
-
122
-
123
-
124
-
125
-
126
-
127
-
128
-
129
-
130
-
131
 |
 |

61
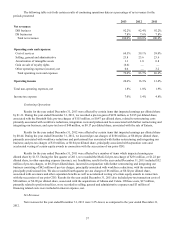
Income tax expense for the years ended December 31, 2012 and 2011 included discrete income tax benefits of $3
million and $18 million, respectively. Discrete income tax benefits for 2011 were primarily associated with certain state tax
planning initiatives and the favorable resolution of certain tax contingencies.
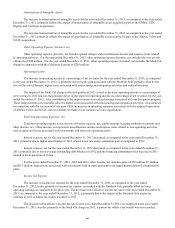
Discontinued Operations
Discontinued operations includes HemoCue, which was sold in April 2013, OralDNA, which was sold in December
2012, and NID, a test kit manufacturing subsidiary. The results of operations for HemoCue, OralDNA and NID have been
classified as discontinued operations for all periods presented. See Note 19 to the consolidated financial statements for further
details.
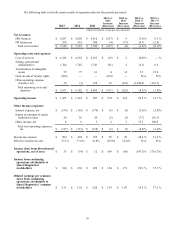
The following table summarizes our income (loss) from discontinued operations, net of taxes:
2013 vs.
2012
Increase
(Decrease)
2012 vs.
2011
Increase
(Decrease)
2013 2012 2011
(dollars in millions)
Net revenues $ 28 $ 117 $ 119 $ (89)$ (2)
Income (loss) from discontinued operations before taxes 25 (74)799
(81)
Income tax expense (benefit) (10)— (5)(10)5
Income (loss) from discontinued operations, net of taxes $ 35 $ (74) $ 12 $ 109 $ (86)
Income (loss) from discontinued operations, net of taxes for the year ended December 31, 2013 includes a gain of $14
million (including foreign currency translation adjustments, partially offset by income tax expense and transaction costs)
associated with the sale of HemoCue. In addition, income (loss) from discontinued operations, net of taxes for the year ended
December 31, 2013 includes discrete tax benefits of $20 million associated with favorable resolution of certain tax
contingencies related to NID.
Income (loss) from discontinued operations, net of taxes for the year ended December 31, 2012 included a $78 million
asset impairment charge associated with HemoCue and $8 million loss on the sale associated with OralDNA. Income tax
expense for the year ended December 31, 2012 included a $8 million income tax expense related to the re-valuation of certain
deferred tax assets associated with HemoCue and was partially offset by a $4 million income tax benefit related to the
remeasurement of deferred taxes associated with HemoCue as a result of an enacted income tax rate change in Sweden.
Quantitative and Qualitative Disclosures About Market Risk
We address our exposure to market risks, principally the market risk of changes in interest rates, through a controlled
program of risk management that includes the use of derivative financial instruments. We do not hold or issue derivative
financial instruments for speculative purposes. We believe that our exposures to foreign exchange impacts and changes in
commodity prices are not material to our consolidated financial condition or results of operations. See Note 14 to the
consolidated financial statements for additional discussion of our financial instruments and hedging activities.
At December 31, 2013 and 2012, the fair value of our debt was estimated at approximately $3.5 billion and $3.8
billion, respectively, using quoted active market prices and yields for the same or similar types of borrowings, taking into
account the underlying terms of the debt instruments. At December 31, 2013 and 2012, the estimated fair value exceeded the
carrying value of the debt by $184 million and $481 million, respectively. A hypothetical 10% increase in interest rates
(representing 47 basis points and 48 basis points at December 31, 2013 and 2012, respectively) would potentially reduce the
estimated fair value of our debt by approximately $107 million and $98 million at December 31, 2013 and 2012, respectively.
Borrowings under our floating rate senior notes due March 2014, our senior unsecured revolving credit facility and our
secured receivables credit facility are subject to variable interest rates. Interest on our secured receivables credit facility is
based on rates that are intended to approximate commercial paper rates for highly rated issuers. Interest on our senior
unsecured revolving credit facility is subject to a pricing schedule that can fluctuate based on changes in our credit ratings. As
such, our borrowing cost under this credit arrangement will be subject to both fluctuations in interest rates and changes in our
credit ratings. At December 31, 2013, the borrowing rates under these debt instruments were: for our floating rate senior notes
due March 2014, LIBOR plus 0.85%; for our senior unsecured revolving credit facility, LIBOR plus 1.125%; and for our
secured receivables credit facility, 0.86%. At December 31, 2013, the weighted average LIBOR was 0.2%. As of