Quest Diagnostics 2013 Annual Report Download - page 67
Download and view the complete annual report
Please find page 67 of the 2013 Quest Diagnostics annual report below. You can navigate through the pages in the report by either clicking on the pages listed below, or by using the keyword search tool below to find specific information within the annual report.-
 1
1 -
2
-
3
-
4
-
5
-
6
-
7
-
8
-
9
-
10
-
11
-
12
-
13
-
14
-
15
-
16
-
17
-
18
-
19
-
20
-
21
-
22
-
23
-
24
-
25
-
26
-
27
-
28
-
29
-
30
-
31
-
32
-
33
-
34
-
35
-
36
-
37
-
38
-
39
-
40
-
41
-
42
-
43
-
44
-
45
-
46
-
47
-
48
-
49
-
50
-
51
-
52
-
53
-
54
-
55
-
56
-
 57
57 -
 58
58 -
 59
59 -
 60
60 -
 61
61 -
 62
62 -
 63
63 -
 64
64 -
 65
65 -
 66
66 -
 67
67 -
 68
68 -
 69
69 -
 70
70 -
 71
71 -
 72
72 -
 73
73 -
 74
74 -
 75
75 -
 76
76 -
 77
77 -
78
-
79
-
80
-
81
-
82
-
83
-
84
-
85
-
86
-
87
-
88
-
89
-
90
-
91
-
92
-
93
-
94
-
95
-
96
-
97
-
98
-
99
-
100
-
101
-
102
-
103
-
104
-
105
-
106
-
107
-
108
-
109
-
110
-
111
-
112
-
113
-
114
-
115
-
116
-
117
-
118
-
119
-
120
-
121
-
122
-
123
-
124
-
125
-
126
-
127
-
128
-
129
-
130
-
131
 |
 |

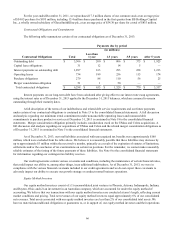
63
things, the enterprises’ ability to raise additional capital or derive cash inflows from continuing operations or through liquidity
events such as initial public offerings, mergers or private sales.
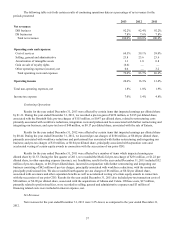
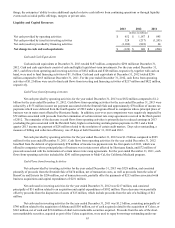
Liquidity and Capital Resources
2013 2012 2011
(dollars in millions)
Net cash provided by operating activities $ 652 $ 1,187 $ 895
Net cash provided by (used in) investing activities 328 (217)(1,243)
Net cash (used in) provided by financing activities (1,106)(822)64
Net change in cash and cash equivalents $(126) $ 148 $ (284)
Cash and Cash Equivalents
Cash and cash equivalents at December 31, 2013 totaled $187 million, compared to $296 million at December 31,
2012. Cash and cash equivalents consist of cash and highly liquid short-term investments. For the year ended December 31,
2013, cash flows from operating and investing activities of $652 million and $328 million, respectively, together with cash on
hand, were used to fund financing activities of $1.1 billion. Cash and cash equivalents at December 31, 2012 totaled $296
million compared to $165 million at December 31, 2011. For the year ended December 31, 2012, cash flows from operating
activities of $1.2 billion were used to fund cash flows from investing and financing activities of $217 million and $822 million,
respectively.
Cash Flows from Operating Activities
Net cash provided by operating activities for the year ended December 31, 2013 was $652 million compared to $1.2
billion for the year ended December 31, 2012. Cash flows from operating activities for the year ended December 31, 2013 were
reduced by a $175 million income tax payment associated with the Ibrutinib Sale and approximately $70 million of income tax
payments which were deferred from the fourth quarter of 2012 under a program offered to companies whose principal place of
business was in states most affected by Hurricane Sandy. In addition, year-over year comparisons were negatively impacted by
$72 million associated with proceeds from the termination of certain interest rate swap agreements received in the third quarter
of 2012. The remainder of the decrease in cash flows from operating activities is primarily due to reduced earnings in 2013
(excluding the gain associated with the Ibrutinib Sale), higher restructuring and integration payments in 2013 and a third
quarter 2013 income tax payment of $28 million related to the resolution of certain audit matters. Days sales outstanding, a
measure of billing and collection efficiency, was 47 days at both December 31, 2013 and 2012.
Net cash provided by operating activities for the year ended December 31, 2012 was $1.2 billion compared to $895
million for the year ended December 31, 2011. Cash flows from operating activities for the year ended December 31, 2012
benefited from the deferral of approximately $70 million of income tax payments into the first quarter of 2013, which was
offered to companies whose principal place of business was in states most affected by Hurricane Sandy, and $72 million of
proceeds associated with the termination of certain interest rate swap agreements. For the year ended December 31, 2011, cash
flows from operating activities included the $241 million payment to Medi-Cal, the California Medicaid program.
Cash Flows from Investing Activities
Net cash provided by investing activities for the year ended December 31, 2013 was $328 million, and consisted
primarily of proceeds from the Ibrutinib Sale of $474 million, net of transaction costs, as well as proceeds from the sales of
HemoCue and Enterix for $296 million, net of transaction costs, partially offset by payments of $213 million associated with
business acquisitions and capital expenditures of $231 million.
Net cash used in investing activities for the year ended December 31, 2012 was $217 million, and consisted
principally of $51 million related to an acquisition and capital expenditures of $182 million. These decreases were partially
offset by proceeds from the disposition of assets of $15 million, which include proceeds from the sale of a building of $12
million.
Net cash used in investing activities for the year ended December 31, 2011 was $1.2 billion, consisting principally of
$740 million related to the acquisition of Athena and $556 million, net of cash acquired related to the acquisition of Celera, or
$343 million, net of cash and $214 million of short-term marketable securities acquired. Proceeds from the sale of the short-
term marketable securities, acquired as part of the Celera acquisition, were used to repay borrowings outstanding under our