Quest Diagnostics 2013 Annual Report Download - page 48
Download and view the complete annual report
Please find page 48 of the 2013 Quest Diagnostics annual report below. You can navigate through the pages in the report by either clicking on the pages listed below, or by using the keyword search tool below to find specific information within the annual report.-
 1
1 -
2
-
3
-
4
-
5
-
6
-
7
-
8
-
9
-
10
-
11
-
12
-
13
-
14
-
15
-
16
-
17
-
18
-
19
-
20
-
21
-
22
-
23
-
24
-
25
-
26
-
27
-
28
-
29
-
30
-
31
-
32
-
33
-
34
-
35
-
36
-
37
-
 38
38 -
 39
39 -
 40
40 -
 41
41 -
 42
42 -
 43
43 -
 44
44 -
 45
45 -
 46
46 -
 47
47 -
 48
48 -
 49
49 -
 50
50 -
 51
51 -
 52
52 -
 53
53 -
 54
54 -
 55
55 -
 56
56 -
 57
57 -
 58
58 -
59
-
60
-
61
-
62
-
63
-
64
-
65
-
66
-
67
-
68
-
69
-
70
-
71
-
72
-
73
-
74
-
75
-
76
-
77
-
78
-
79
-
80
-
81
-
82
-
83
-
84
-
85
-
86
-
87
-
88
-
89
-
90
-
91
-
92
-
93
-
94
-
95
-
96
-
97
-
98
-
99
-
100
-
101
-
102
-
103
-
104
-
105
-
106
-
107
-
108
-
109
-
110
-
111
-
112
-
113
-
114
-
115
-
116
-
117
-
118
-
119
-
120
-
121
-
122
-
123
-
124
-
125
-
126
-
127
-
128
-
129
-
130
-
131
 |
 |

44
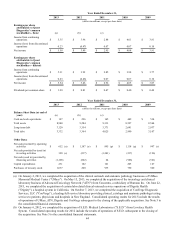
Year Ended December 31,
2013 2012 2011 2010 2009
(dollars in millions, except per share data)
Earnings per share
attributable to Quest
Diagnostics' common
stockholders - basic: (a) (b) (c)
Income from continuing
operations $ 5.35 $ 3.96 $ 2.88 $ 4.01 $ 3.81
Income (loss) from discontinued
operations 0.23 (0.47) 0.07 0.07 0.10
Net income $ 5.58 $ 3.49 $ 2.95 $ 4.08 $ 3.91
Earnings per share
attributable to Quest
Diagnostics' common
stockholders - diluted:
Income from continuing
operations $ 5.31 $ 3.92 $ 2.85 $ 3.98 $ 3.77
Income (loss) from discontinued
operations 0.23 (0.46) 0.07 0.07 0.10
Net income $ 5.54 $ 3.46 $ 2.92 $ 4.05 $ 3.87
Dividends per common share $ 1.20 $ 0.81 $ 0.47 $ 0.40 $ 0.40
Year Ended December 31,
2013 2012 2011 2010 2009
(dollars in millions, except per share data)
Balance Sheet Data (at end of
year): (a) (b) (c)
Cash and cash equivalents $ 187 $ 296 $ 165 $ 449 $ 534
Total assets 8,948 9,284 9,313 8,527 8,564
Long-term debt 3,120 3,354 3,371 2,641 2,937
Total debt 3,332 3,364 4,025 2,990 3,107
Other Data:
Net cash provided by operating
activities $ 652 (n) $ 1,187 (o) $ 895 (p) $ 1,118 (q) $ 997 (r)
Net cash provided by (used in)
investing activities 328 (s) (217) (1,243) (217) (196)
Net cash (used in) provided by
financing activities (1,106) (822) 64 (986) (521)
Capital expenditures 231 182 161 205 167
Purchases of treasury stock 1,037 200 935 750 500
(a) On January 2, 2013, we completed the acquisition of the clinical outreach and anatomic pathology businesses of UMass
Memorial Medical Center ("UMass"). On May 15, 2013, we completed the acquisition of the toxicology and clinical
laboratory business of Advanced Toxicology Network ("ATN") from Concentra, a subsidiary of Humana Inc. On June 22,
2013, we completed the acquisition of certain lab-related clinical outreach service operations of Dignity Health
("Dignity"), a hospital system in California. On October 7, 2013, we completed the acquisition of ConVerge Diagnostic
Services, LLC ("ConVerge"), a leading full-service laboratory providing clinical, cytology and anatomic pathology testing
services to patients, physicians and hospitals in New England. Consolidated operating results for 2013 include the results
of operations of UMass, ATN, Dignity and ConVerge subsequent to the closing of the applicable acquisition. See Note 5 to
the consolidated financial statements.
(b) On January 6, 2012, we completed the acquisition of S.E.D. Medical Laboratories ("S.E.D.") from Lovelace Health
System. Consolidated operating results for 2012 include the results of operations of S.E.D. subsequent to the closing of
the acquisition. See Note 5 to the consolidated financial statements.