Quest Diagnostics 2013 Annual Report Download - page 87
Download and view the complete annual report
Please find page 87 of the 2013 Quest Diagnostics annual report below. You can navigate through the pages in the report by either clicking on the pages listed below, or by using the keyword search tool below to find specific information within the annual report.-
 1
1 -
2
-
3
-
4
-
5
-
6
-
7
-
8
-
9
-
10
-
11
-
12
-
13
-
14
-
15
-
16
-
17
-
18
-
19
-
20
-
21
-
22
-
23
-
24
-
25
-
26
-
27
-
28
-
29
-
30
-
31
-
32
-
33
-
34
-
35
-
36
-
37
-
38
-
39
-
40
-
41
-
42
-
43
-
44
-
45
-
46
-
47
-
48
-
49
-
50
-
51
-
52
-
53
-
54
-
55
-
56
-
57
-
58
-
59
-
60
-
61
-
62
-
63
-
64
-
65
-
66
-
67
-
68
-
69
-
70
-
71
-
72
-
73
-
74
-
75
-
76
-
 77
77 -
 78
78 -
 79
79 -
 80
80 -
 81
81 -
 82
82 -
 83
83 -
 84
84 -
 85
85 -
 86
86 -
 87
87 -
 88
88 -
 89
89 -
 90
90 -
 91
91 -
 92
92 -
 93
93 -
 94
94 -
 95
95 -
 96
96 -
 97
97 -
98
-
99
-
100
-
101
-
102
-
103
-
104
-
105
-
106
-
107
-
108
-
109
-
110
-
111
-
112
-
113
-
114
-
115
-
116
-
117
-
118
-
119
-
120
-
121
-
122
-
123
-
124
-
125
-
126
-
127
-
128
-
129
-
130
-
131
 |
 |

F- 15
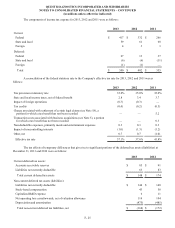
3. EARNINGS PER SHARE
The computation of basic and diluted earnings per common share is as follows (in millions, except per share data):
2013 2012 2011
Amounts attributable to Quest Diagnostics’ stockholders:
Income from continuing operations $ 814 $ 630 $ 459
Income (loss) from discontinued operations, net of taxes 35 (74)12
Net income attributable to Quest Diagnostics’ common stockholders $ 849 $ 556 $ 471
Income from continuing operations $ 814 $ 630 $ 459
Less: Earnings allocated to participating securities 3 2 3
Earnings available to Quest Diagnostics’ common stockholders – basic and
diluted $ 811 $ 628 $ 456
Weighted average common shares outstanding – basic 152 159 159
Effect of dilutive securities:
Stock options and performance share units 1 1 1
Weighted average common shares outstanding – diluted 153 160 160
Earnings per share attributable to Quest Diagnostics’ common
stockholders – basic:
Income from continuing operations $ 5.35 $ 3.96 $ 2.88
Income (loss) from discontinued operations 0.23 (0.47) 0.07
Net income $ 5.58 $ 3.49 $ 2.95
Earnings per share attributable to Quest Diagnostics’ common
stockholders – diluted:
Income from continuing operations $ 5.31 $ 3.92 $ 2.85
Income (loss) from discontinued operations 0.23 (0.46) 0.07
Net income $ 5.54 $ 3.46 $ 2.92
The following securities were not included in the calculation of diluted earnings per share due to their antidilutive
effect:
2013 2012 2011
Stock options and performance share units 1 2 2
4. RESTRUCTURING ACTIVITIES
Invigorate Program
During 2012, the Company committed to a course of action related to a multi-year program called Invigorate which is
designed to reduce its cost structure. The Invigorate program is intended to mitigate the impact of continued reimbursement
pressures and labor and benefit cost increases, free up additional resources to invest in science, innovation and other growth
initiatives, and enable the Company to improve operating profitability and quality.
In connection with the Invigorate program, the Company launched a voluntary retirement program to certain eligible
employees in 2012. The voluntary retirement program was essentially completed at the end of the first quarter of 2013.
QUEST DIAGNOSTICS INCORPORATED AND SUBSIDIARIES
NOTES TO CONSOLIDATED FINANCIAL STATEMENTS – CONTINUED
(in millions unless otherwise indicated)