Quest Diagnostics 2013 Annual Report Download - page 122
Download and view the complete annual report
Please find page 122 of the 2013 Quest Diagnostics annual report below. You can navigate through the pages in the report by either clicking on the pages listed below, or by using the keyword search tool below to find specific information within the annual report.-
 1
1 -
2
-
3
-
4
-
5
-
6
-
7
-
8
-
9
-
10
-
11
-
12
-
13
-
14
-
15
-
16
-
17
-
18
-
19
-
20
-
21
-
22
-
23
-
24
-
25
-
26
-
27
-
28
-
29
-
30
-
31
-
32
-
33
-
34
-
35
-
36
-
37
-
38
-
39
-
40
-
41
-
42
-
43
-
44
-
45
-
46
-
47
-
48
-
49
-
50
-
51
-
52
-
53
-
54
-
55
-
56
-
57
-
58
-
59
-
60
-
61
-
62
-
63
-
64
-
65
-
66
-
67
-
68
-
69
-
70
-
71
-
72
-
73
-
74
-
75
-
76
-
77
-
78
-
79
-
80
-
81
-
82
-
83
-
84
-
85
-
86
-
87
-
88
-
89
-
90
-
91
-
92
-
93
-
94
-
95
-
96
-
97
-
98
-
99
-
100
-
101
-
102
-
103
-
104
-
105
-
106
-
107
-
108
-
109
-
110
-
111
-
 112
112 -
 113
113 -
 114
114 -
 115
115 -
 116
116 -
 117
117 -
 118
118 -
 119
119 -
 120
120 -
 121
121 -
 122
122 -
 123
123 -
 124
124 -
 125
125 -
 126
126 -
 127
127 -
 128
128 -
 129
129 -
 130
130 -
 131
131
 |
 |

F- 50
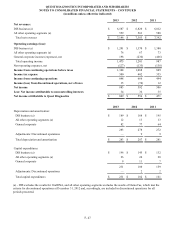
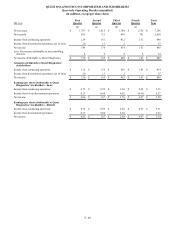
2012 (a)
First
Quarter
Second
Quarter
Third
Quarter
Fourth
Quarter
Total
Year
(f) (g) (h) (i) (j)
Net revenues $ 1,909 $ 1,878 $ 1,822 $ 1,774 $ 7,383
Gross profit 800 776 741 701 3,018
Income from continuing operations 165 184 167 150 666
Income (loss) from discontinued operations, net of
taxes 3 2 5 (84) (74)
Net income 168 186 172 66 592
Less: Net income attributable to noncontrolling
interests 9 8 9 10 36
Net income attributable to Quest Diagnostics $ 159 $ 178 $ 163 $ 56 $ 556
Amounts attributable to Quest Diagnostics'
stockholders:
Income from continuing operations $ 156 $ 176 $ 158 $ 140 $ 630
Income (loss) from discontinued operations, net of
taxes 3 2 5 (84) (74)
Net income $ 159 $ 178 $ 163 $ 56 $ 556
Earnings per share attributable to Quest
Diagnostics' stockholders - basic:
Income from continuing operations $ 0.98 $ 1.10 $ 0.99 $ 0.88 $ 3.96
Income (loss) from discontinued operations 0.02 0.02 0.03 (0.53) (0.47)
Net income $ 1.00 $ 1.12 $ 1.02 $ 0.35 $ 3.49
Earnings per share attributable to Quest
Diagnostics' stockholders - diluted:
Income from continuing operations $ 0.97 $ 1.09 $ 0.98 $ 0.87 $ 3.92
Income (loss) from discontinued operations 0.02 0.02 0.03 (0.53) (0.46)
Net income $ 0.99 $ 1.11 $ 1.01 $ 0.34 $ 3.46
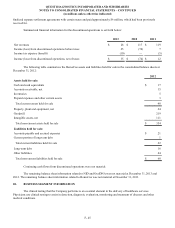
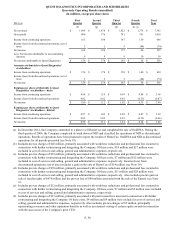
(a) In December 2012, the Company committed to a plan to sell HemoCue and completed the sale of OralDNA. During the
third quarter of 2006, the Company completed its wind down of NID and classified the operations of NID as discontinued
operations. Results of operations have been prepared to report the results of HemoCue, OralDNA and NID as discontinued
operations for all periods presented (see Note 19).
(b) Includes pre-tax charges of $45 million, primarily associated with workforce reductions and professional fees incurred in
connection with further restructuring and integrating the Company. Of these costs, $18 million and $27 million were
included in cost of services and selling, general and administrative expenses, respectively.
(c) Includes pre-tax charges of $19 million, primarily associated with workforce reductions and professional fees incurred in
connection with further restructuring and integrating the Company. Of these costs, $7 million and $12 million were
included in cost of services and selling, general and administrative expenses, respectively. Income (loss) from
discontinued operations, net of taxes includes a gain on the sale of HemoCue of $14 million (see Note 19).
(d) Includes pre-tax charges of $39 million, primarily associated with workforce reductions and professional fees incurred in
connection with further restructuring and integrating the Company. Of these costs, $11 million and $28 million were
included in cost of services and selling, general and administrative expenses, respectively. Also includes pre-tax gain on
sale of royalty rights of $474 million and the pre-tax loss of $40 million associated with the sale of the Enterix (see Note
6).
(e) Includes pre-tax charges of $12 million, primarily associated with workforce reductions and professional fees incurred in
connection with further restructuring and integrating the Company. Of these costs, $7 million and $5 million were included
in cost of services and selling, general and administrative expenses, respectively.
(f) Includes pre-tax charges of $13 million, primarily associated with professional fees incurred in connection with further
restructuring and integrating the Company. Of these costs, $4 million and $9 million were included in cost of services and
selling, general and administrative expenses, respectively. Also includes pre-tax charges of $7 million, principally
representing severance and other separation benefits as well as accelerated vesting of certain equity awards in connection
with the succession of the Company's prior CEO.
QUEST DIAGNOSTICS INCORPORATED AND SUBSIDIARIES
Quarterly Operating Results (unaudited)
(in millions, except per share data)