Quest Diagnostics 2013 Annual Report Download - page 96
Download and view the complete annual report
Please find page 96 of the 2013 Quest Diagnostics annual report below. You can navigate through the pages in the report by either clicking on the pages listed below, or by using the keyword search tool below to find specific information within the annual report.-
 1
1 -
2
-
3
-
4
-
5
-
6
-
7
-
8
-
9
-
10
-
11
-
12
-
13
-
14
-
15
-
16
-
17
-
18
-
19
-
20
-
21
-
22
-
23
-
24
-
25
-
26
-
27
-
28
-
29
-
30
-
31
-
32
-
33
-
34
-
35
-
36
-
37
-
38
-
39
-
40
-
41
-
42
-
43
-
44
-
45
-
46
-
47
-
48
-
49
-
50
-
51
-
52
-
53
-
54
-
55
-
56
-
57
-
58
-
59
-
60
-
61
-
62
-
63
-
64
-
65
-
66
-
67
-
68
-
69
-
70
-
71
-
72
-
73
-
74
-
75
-
76
-
77
-
78
-
79
-
80
-
81
-
82
-
83
-
84
-
85
-
 86
86 -
 87
87 -
 88
88 -
 89
89 -
 90
90 -
 91
91 -
 92
92 -
 93
93 -
 94
94 -
 95
95 -
 96
96 -
 97
97 -
 98
98 -
 99
99 -
 100
100 -
 101
101 -
 102
102 -
 103
103 -
 104
104 -
 105
105 -
 106
106 -
107
-
108
-
109
-
110
-
111
-
112
-
113
-
114
-
115
-
116
-
117
-
118
-
119
-
120
-
121
-
122
-
123
-
124
-
125
-
126
-
127
-
128
-
129
-
130
-
131
 |
 |

F- 24
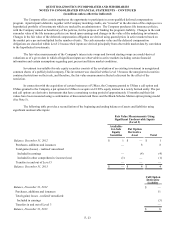
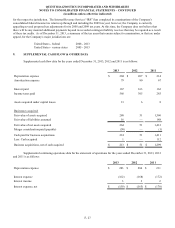
The unrealized gains and losses included in earnings for the year ended December 31, 2013 are reported in other non-
operating income.
The carrying amounts of cash and cash equivalents, accounts receivable, accounts payable and accrued expenses
approximate fair value based on the short maturities of these instruments. At December 31, 2013, the fair value of the
Company’s debt was estimated at $3.5 billion, which exceeded the carrying value by $184 million. At December 31, 2012, the
fair value of the Company's debt was estimated at $3.8 billion, which exceeded the carrying value by $481 million. Principally
all of the Company's debt is classified within Level 1 of the fair value hierarchy because the fair value of the debt is estimated
based on rates currently offered to the Company with identical terms and maturities, using quoted active market prices and
yields, taking into account the underlying terms of the debt instruments.
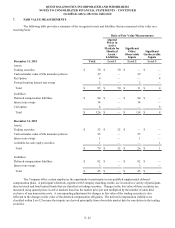
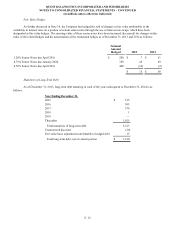
The following table provides a summary of the recognized assets and liabilities that are measured at fair value on a
non-recurring basis:
Basis of Fair Value Measurements
Quoted
Prices in
Active
Markets for
Identical
Assets /
Liabilities
Significant
Other
Observable
Inputs
Significant
Unobservable
Inputs Total Loss
December 31, 2012 Level 1 Level 2 Level 3
Net assets held for sale $ 312 $ — $ 312 $ — $ 78
In connection with the Company's agreement to sell HemoCue and upon classification of this business as discontinued
operations during the fourth quarter of 2012, net assets held for sale with a carrying amount of $390 million were written down
to their fair value of $317 million, less estimated costs to sell of $5 million (or $312 million), resulting in a loss of $78 million.
This charge was included in income (loss) from discontinued operations, net of taxes. Net assets held for sale at December 31,
2012, were classified within Level 2 and were measured based upon the estimated proceeds associated with the agreement to
sell HemoCue.
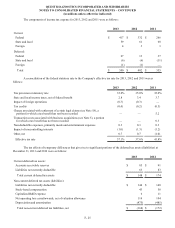
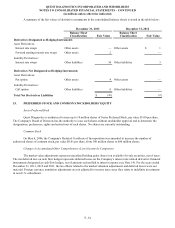
8. TAXES ON INCOME
The Company's pre-tax income from continuing operations consisted of $1.3 billion, $1.1 billion and $836 million
from U.S. operations and $19 million, $18 million and $13 million from foreign operations for the years ended December 31,
2013, 2012 and 2011, respectively.
For the year ended December 31, 2013, pre-tax income from continuing operations in the U.S., income tax expense
and the effective tax rate, including the state and local income tax rate, net of federal benefit, were impacted by the gain on sale
of royalty rights. For further details regarding the sale of royalty rights, see Note 6.
QUEST DIAGNOSTICS INCORPORATED AND SUBSIDIARIES
NOTES TO CONSOLIDATED FINANCIAL STATEMENTS – CONTINUED
(in millions unless otherwise indicated)