Quest Diagnostics 2013 Annual Report Download - page 111
Download and view the complete annual report
Please find page 111 of the 2013 Quest Diagnostics annual report below. You can navigate through the pages in the report by either clicking on the pages listed below, or by using the keyword search tool below to find specific information within the annual report.-
 1
1 -
2
-
3
-
4
-
5
-
6
-
7
-
8
-
9
-
10
-
11
-
12
-
13
-
14
-
15
-
16
-
17
-
18
-
19
-
20
-
21
-
22
-
23
-
24
-
25
-
26
-
27
-
28
-
29
-
30
-
31
-
32
-
33
-
34
-
35
-
36
-
37
-
38
-
39
-
40
-
41
-
42
-
43
-
44
-
45
-
46
-
47
-
48
-
49
-
50
-
51
-
52
-
53
-
54
-
55
-
56
-
57
-
58
-
59
-
60
-
61
-
62
-
63
-
64
-
65
-
66
-
67
-
68
-
69
-
70
-
71
-
72
-
73
-
74
-
75
-
76
-
77
-
78
-
79
-
80
-
81
-
82
-
83
-
84
-
85
-
86
-
87
-
88
-
89
-
90
-
91
-
92
-
93
-
94
-
95
-
96
-
97
-
98
-
99
-
100
-
 101
101 -
 102
102 -
 103
103 -
 104
104 -
 105
105 -
 106
106 -
 107
107 -
 108
108 -
 109
109 -
 110
110 -
 111
111 -
 112
112 -
 113
113 -
 114
114 -
 115
115 -
 116
116 -
 117
117 -
 118
118 -
 119
119 -
 120
120 -
 121
121 -
122
-
123
-
124
-
125
-
126
-
127
-
128
-
129
-
130
-
131
 |
 |

F- 39
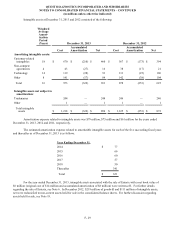
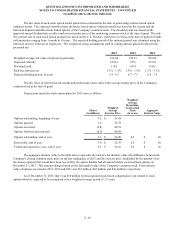
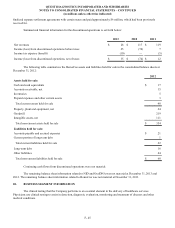
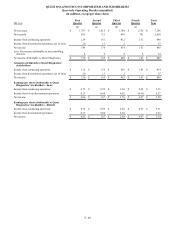
The following summarizes the activity relative to stock awards, including restricted stock awards, restricted stock
units and performance share units, for 2013, 2012 and 2011:
2013 2012 2011
Shares
(in millions)
Weighted
Average
Grant Date
Fair Value
Shares
(in millions)
Weighted
Average
Grant Date
Fair Value
Shares
(in millions)
Weighted
Average
Grant Date
Fair Value
Shares outstanding, beginning of year 1.2 $ 56.84 2.0 $ 54.61 2.1 $ 51.54
Shares granted 0.8 56.79 0.8 57.78 0.9 56.81
Shares vested (0.5) 56.25 (0.9) 52.62 (0.9) 48.93
Shares forfeited and canceled (0.1) 56.92 (0.1) 57.09 (0.1) 55.47
Adjustment to estimate of performance
share units to be earned (0.7) 56.84 (0.6) 57.06 — 53.23
Shares outstanding, end of year 0.7 $ 57.20 1.2 $ 56.84 2.0 $ 54.61
As of December 31, 2013, there was $14 million of unrecognized stock-based compensation cost related to nonvested
stock awards, which is expected to be recognized over a weighted average period of 1.9 years. Total fair value of shares vested
was $28 million, $53 million and $53 million for the years ended December 31, 2013, 2012 and 2011, respectively. The
amount of unrecognized stock-based compensation cost is subject to change based on revisions, if any, to management's best
estimates of the achievement of the performance goals specified in such awards and the resulting number of shares that will be
earned at the end of the performance periods.
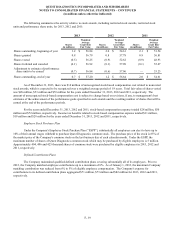
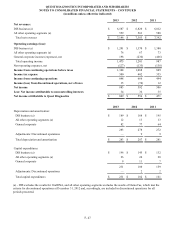
For the years ended December 31, 2013, 2012 and 2011, stock-based compensation expense totaled $28 million, $50
million and $72 million, respectively. Income tax benefits related to stock-based compensation expense totaled $11 million,
$19 million and $28 million for the years ended December 31, 2013, 2012 and 2011, respectively.
Employee Stock Purchase Plan
Under the Company's Employee Stock Purchase Plan (“ESPP”), substantially all employees can elect to have up to
10% of their annual wages withheld to purchase Quest Diagnostics common stock. The purchase price of the stock is 85% of
the market price of the Company's common stock on the last business day of each calendar month. Under the ESPP, the
maximum number of shares of Quest Diagnostics common stock which may be purchased by eligible employees is 5 million.
Approximately 404, 406 and 425 thousand shares of common stock were purchased by eligible employees in 2013, 2012 and
2011, respectively.
Defined Contribution Plans
The Company maintained qualified defined contribution plans covering substantially all of its employees. Prior to
2012, the Company matched employee contributions up to a maximum of 6%. As of January 1, 2012, the maximum Company
matching contribution was reduced from 6% to 5% of eligible employee compensation. The Company's expense for
contributions to its defined contribution plans aggregated $71 million, $73 million and $82 million for 2013, 2012 and 2011,
respectively.
QUEST DIAGNOSTICS INCORPORATED AND SUBSIDIARIES
NOTES TO CONSOLIDATED FINANCIAL STATEMENTS – CONTINUED
(in millions unless otherwise indicated)