Quest Diagnostics 2013 Annual Report Download - page 110
Download and view the complete annual report
Please find page 110 of the 2013 Quest Diagnostics annual report below. You can navigate through the pages in the report by either clicking on the pages listed below, or by using the keyword search tool below to find specific information within the annual report.-
 1
1 -
2
-
3
-
4
-
5
-
6
-
7
-
8
-
9
-
10
-
11
-
12
-
13
-
14
-
15
-
16
-
17
-
18
-
19
-
20
-
21
-
22
-
23
-
24
-
25
-
26
-
27
-
28
-
29
-
30
-
31
-
32
-
33
-
34
-
35
-
36
-
37
-
38
-
39
-
40
-
41
-
42
-
43
-
44
-
45
-
46
-
47
-
48
-
49
-
50
-
51
-
52
-
53
-
54
-
55
-
56
-
57
-
58
-
59
-
60
-
61
-
62
-
63
-
64
-
65
-
66
-
67
-
68
-
69
-
70
-
71
-
72
-
73
-
74
-
75
-
76
-
77
-
78
-
79
-
80
-
81
-
82
-
83
-
84
-
85
-
86
-
87
-
88
-
89
-
90
-
91
-
92
-
93
-
94
-
95
-
96
-
97
-
98
-
99
-
 100
100 -
 101
101 -
 102
102 -
 103
103 -
 104
104 -
 105
105 -
 106
106 -
 107
107 -
 108
108 -
 109
109 -
 110
110 -
 111
111 -
 112
112 -
 113
113 -
 114
114 -
 115
115 -
 116
116 -
 117
117 -
 118
118 -
 119
119 -
 120
120 -
121
-
122
-
123
-
124
-
125
-
126
-
127
-
128
-
129
-
130
-
131
 |
 |

F- 38
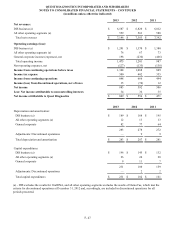
The fair value of each stock option award granted was estimated on the date of grant using a lattice-based option-
valuation model. The expected volatility under the lattice-based option-valuation model was based on the current and the
historical implied volatilities from traded options of the Company's common stock. The dividend yield was based on the
approved annual dividend rate in effect and current market price of the underlying common stock at the time of grant. The risk-
free interest rate of each stock option granted was based on the U.S. Treasury yield curve in effect at the time of grant for bonds
with maturities ranging from 1 month to 10 years. The expected holding period of the options granted was estimated using the
historical exercise behavior of employees. The weighted average assumptions used in valuing options granted in the periods
presented are:
2013 2012 2011
Weighted average fair value of options at grant date $12.64 $15.87 $18.08
Expected volatility 25.8% 27% 27.2%
Dividend yield 1.4% 0.9% 0.8%
Risk-free interest rate 1.1% - 1.3% 1.3% - 1.5% 2.7% - 3.1%
Expected holding period, in years 5.5 - 6.7 6.7 - 7.5 6.8 - 7.6
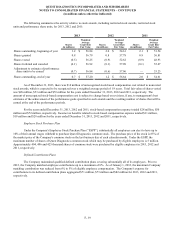
The fair value of restricted stock awards and performance share units is the average market price of the Company's
common stock at the date of grant.
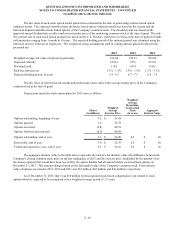
Transactions under the stock option plans for 2013 were as follows:
Shares
(in millions)
Weighted
Average
Exercise Price
Weighted
Average
Remaining
Contractual
Term
(in years)
Aggregate
Intrinsic Value
Options outstanding, beginning of year 7.8 $ 51.68
Options granted 1.6 56.78
Options exercised (2.8) 49.19
Options forfeited and canceled (0.3) 49.69
Options outstanding, end of year 6.3 $ 54.20 6.2 $ 10
Exercisable, end of year 3.8 $ 52.39 2.6 $ 10
Vested and expected to vest, end of year 6.1 $ 54.16 6.2 $ 10
The aggregate intrinsic value in the table above represents the total pre-tax intrinsic value (the difference between the
Company's closing common stock price on the last trading day of 2013 and the exercise price, multiplied by the number of in-
the-money options) that would have been received by the option holders had all option holders exercised their options on
December 31, 2013. This amount changes based on the fair market value of the Company's common stock. Total intrinsic
value of options exercised in 2013, 2012 and 2011 was $32 million, $45 million and $43 million, respectively.
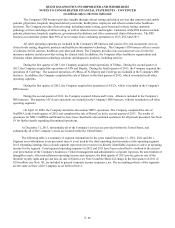
As of December 31, 2013, there was $10 million of unrecognized stock-based compensation cost related to stock
options which is expected to be recognized over a weighted average period of 1.9 years.
QUEST DIAGNOSTICS INCORPORATED AND SUBSIDIARIES
NOTES TO CONSOLIDATED FINANCIAL STATEMENTS – CONTINUED
(in millions unless otherwise indicated)