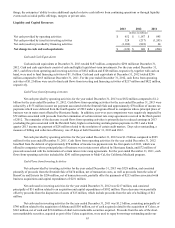
Quest Diagnostics 2013 Annual Report Download - page 77
Download and view the complete annual report
Please find page 77 of the 2013 Quest Diagnostics annual report below. You can navigate through the pages in the report by either clicking on the pages listed below, or by using the keyword search tool below to find specific information within the annual report.-
 1
1 -
2
-
3
-
4
-
5
-
6
-
7
-
8
-
9
-
10
-
11
-
12
-
13
-
14
-
15
-
16
-
17
-
18
-
19
-
20
-
21
-
22
-
23
-
24
-
25
-
26
-
27
-
28
-
29
-
30
-
31
-
32
-
33
-
34
-
35
-
36
-
37
-
38
-
39
-
40
-
41
-
42
-
43
-
44
-
45
-
46
-
47
-
48
-
49
-
50
-
51
-
52
-
53
-
54
-
55
-
56
-
57
-
58
-
59
-
60
-
61
-
62
-
63
-
64
-
65
-
66
-
 67
67 -
 68
68 -
 69
69 -
 70
70 -
 71
71 -
 72
72 -
 73
73 -
 74
74 -
 75
75 -
 76
76 -
 77
77 -
 78
78 -
 79
79 -
 80
80 -
 81
81 -
 82
82 -
 83
83 -
 84
84 -
 85
85 -
 86
86 -
 87
87 -
88
-
89
-
90
-
91
-
92
-
93
-
94
-
95
-
96
-
97
-
98
-
99
-
100
-
101
-
102
-
103
-
104
-
105
-
106
-
107
-
108
-
109
-
110
-
111
-
112
-
113
-
114
-
115
-
116
-
117
-
118
-
119
-
120
-
121
-
122
-
123
-
124
-
125
-
126
-
127
-
128
-
129
-
130
-
131
 |
 |

F- 5
QUEST DIAGNOSTICS INCORPORATED AND SUBSIDIARIES
CONSOLIDATED STATEMENTS OF CASH FLOWS
FOR THE YEARS ENDED DECEMBER 31, 2013, 2012 AND 2011
(in millions)
2013 2012 2011
Cash flows from operating activities:
Net income $ 883 $ 592 $ 506
Adjustments to reconcile net income to net cash provided by operating activities:
Depreciation and amortization 283 287 281
Provision for doubtful accounts 270 269 280
Deferred income tax provision 19 7 29
Stock-based compensation expense 28 50 72
Excess tax benefits from stock-based compensation arrangements (4) (4) (4)
Gain on sale of royalty rights (474) — —
Asset impairment and loss on sale of businesses, net 17 86 —
Provision for special charge — — 236
Other, net 2(8)8
Changes in operating assets and liabilities:
Accounts receivable (247) (243) (307)
Accounts payable and accrued expenses (21) (13) (18)
Settlement of special charge — — (241)
Income taxes payable (93) 100 39
Termination of interest rate swap agreements — 72 —
Other assets and liabilities, net (11) (8) 14
Net cash provided by operating activities 652 1,187 895
Cash flows from investing activities:
Business acquisitions, net of cash acquired (213) (51) (1,299)
Proceeds from sale of businesses 296 — —
Proceeds from sale of royalty rights 474 — —
Sale of securities acquired in business acquisition — — 214
Capital expenditures (231) (182) (161)
Decrease in investments and other assets 2 16 3
Net cash provided by (used in) investing activities 328 (217) (1,243)
Cash flows from financing activities:
Proceeds from borrowings 896 715 2,689
Repayments of debt (900) (1,369) (1,710)
Purchases of treasury stock (1,037) (200) (935)
Exercise of stock options 138 162 137
Excess tax benefits from stock-based compensation arrangements 4 4 4
Dividends paid (185) (108) (65)
Distributions to noncontrolling interests (32) (38) (36)
Other financing activities, net 10 12 (20)
Net cash (used in) provided by financing activities (1,106) (822) 64
Net change in cash and cash equivalents (126) 148 (284)
Change in cash and cash equivalents included in current assets held for sale 17 (17) —
Cash and cash equivalents, beginning of year 296 165 449
Cash and cash equivalents, end of year $ 187 $ 296 $ 165
The accompanying notes are an integral part of these statements.