Quest Diagnostics 2013 Annual Report Download - page 64
Download and view the complete annual report
Please find page 64 of the 2013 Quest Diagnostics annual report below. You can navigate through the pages in the report by either clicking on the pages listed below, or by using the keyword search tool below to find specific information within the annual report.-
 1
1 -
2
-
3
-
4
-
5
-
6
-
7
-
8
-
9
-
10
-
11
-
12
-
13
-
14
-
15
-
16
-
17
-
18
-
19
-
20
-
21
-
22
-
23
-
24
-
25
-
26
-
27
-
28
-
29
-
30
-
31
-
32
-
33
-
34
-
35
-
36
-
37
-
38
-
39
-
40
-
41
-
42
-
43
-
44
-
45
-
46
-
47
-
48
-
49
-
50
-
51
-
52
-
53
-
 54
54 -
 55
55 -
 56
56 -
 57
57 -
 58
58 -
 59
59 -
 60
60 -
 61
61 -
 62
62 -
 63
63 -
 64
64 -
 65
65 -
 66
66 -
 67
67 -
 68
68 -
 69
69 -
 70
70 -
 71
71 -
 72
72 -
 73
73 -
 74
74 -
75
-
76
-
77
-
78
-
79
-
80
-
81
-
82
-
83
-
84
-
85
-
86
-
87
-
88
-
89
-
90
-
91
-
92
-
93
-
94
-
95
-
96
-
97
-
98
-
99
-
100
-
101
-
102
-
103
-
104
-
105
-
106
-
107
-
108
-
109
-
110
-
111
-
112
-
113
-
114
-
115
-
116
-
117
-
118
-
119
-
120
-
121
-
122
-
123
-
124
-
125
-
126
-
127
-
128
-
129
-
130
-
131
 |
 |
60
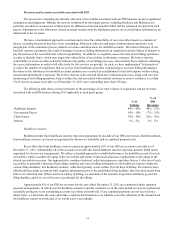
Amortization of Intangible Assets
The increase in amortization of intangible assets for the year ended December 31, 2013, as compared to the year ended
December 31, 2012, primarily reflects the impact of amortization of intangible assets acquired as part of the UMass, ATN,
Dignity and ConVerge acquisitions.
The increase in amortization of intangible assets for the year ended December 31, 2012, as compared to the year ended
December 31, 2011, primarily reflects the impact of amortization of intangible assets acquired as part of the Athena, Celera and
S.E.D. acquisitions.
Other Operating Expense (Income), net
Other operating expense (income), net includes special charges and miscellaneous income and expense items related
to operating activities. For the year ended December 31, 2013, other operating expense (income), net includes the loss on sale
of Enterix of $40 million. For the year ended December 31, 2011, other operating expense (income), net includes the Medi-Cal
charge in connection with the California Lawsuit of $236 million.
Operating Income
The increase in operating income as a percentage of net revenues for the year ended December 31, 2013, as compared
to the year ended December 31, 2012, is primarily driven by the gain associated with the Ibrutinib Sale, partially offset by the
loss on the sale of Enterix, higher costs associated with restructuring and integration activities and reduced revenues.
The impact of the Medi-Cal charge in the first quarter of 2011 served to decrease operating income as a percentage of
net revenues in 2011 and was the principal driver of the improved operating income as a percentage of net revenues for the year
ended December 31, 2012. Also contributing to the improvement was realized savings associated with our Invigorate program.
These improvements were partially offset by higher costs associated with restructuring and integration activities, costs incurred
in connection with the succession of our prior CEO, an increase in operating expenses associated with the acquired operations
of Athena, Celera and S.E.D. and investments we made in our commercial sales organization.
Total Non-Operating Expenses, net
Total non-operating expenses, net consists of interest expense, net, equity earnings in equity method investments and
other income, net. Other income, net represents miscellaneous income and expense items related to non-operating activities,
such as gains and losses associated with investments and other non-operating assets.
Interest expense, net for the year ended December 31, 2013 decreased, as compared to the year ended December 31,
2012, primarily due to higher amortization in 2013 of an interest rate swap termination gain as compared to 2012.
Interest expense, net for the year ended December 31, 2012 decreased, as compared to the year ended December 31,
2011, primarily due to lower average outstanding debt balances in 2012 and the financing commitment fees incurred in 2011
related to the acquisition of Celera.
For the years ended December 31, 2013, 2012 and 2011, other income, net includes gains of $10 million, $7 million
and $0.3 million, respectively, associated with investments held in trusts pursuant to our supplemental deferred compensation
plans.
Income Tax Expense
The increase in income tax expense for the year ended December 31, 2013, as compared to the year ended
December 31, 2012, is due primarily to income tax expense associated with the Ibrutinib Sale, partially offset by lower
operating earnings as compared to the prior year. The decrease in the effective income tax rate for the year ended December 31,
2013, as compared to the year ended December 31, 2012, is primarily due to the impact of the Ibrutinib Sale on pre-tax
earnings as well as higher tax credits recorded in 2013.
The decrease in the effective income tax rate for the year ended December 31, 2012, as compared to the year ended
December 31, 2011, was due primarily to the Medi-Cal charge in 2011, a portion for which a tax benefit was not recorded.