Quest Diagnostics 2013 Annual Report Download - page 119
Download and view the complete annual report
Please find page 119 of the 2013 Quest Diagnostics annual report below. You can navigate through the pages in the report by either clicking on the pages listed below, or by using the keyword search tool below to find specific information within the annual report.-
 1
1 -
2
-
3
-
4
-
5
-
6
-
7
-
8
-
9
-
10
-
11
-
12
-
13
-
14
-
15
-
16
-
17
-
18
-
19
-
20
-
21
-
22
-
23
-
24
-
25
-
26
-
27
-
28
-
29
-
30
-
31
-
32
-
33
-
34
-
35
-
36
-
37
-
38
-
39
-
40
-
41
-
42
-
43
-
44
-
45
-
46
-
47
-
48
-
49
-
50
-
51
-
52
-
53
-
54
-
55
-
56
-
57
-
58
-
59
-
60
-
61
-
62
-
63
-
64
-
65
-
66
-
67
-
68
-
69
-
70
-
71
-
72
-
73
-
74
-
75
-
76
-
77
-
78
-
79
-
80
-
81
-
82
-
83
-
84
-
85
-
86
-
87
-
88
-
89
-
90
-
91
-
92
-
93
-
94
-
95
-
96
-
97
-
98
-
99
-
100
-
101
-
102
-
103
-
104
-
105
-
106
-
107
-
108
-
 109
109 -
 110
110 -
 111
111 -
 112
112 -
 113
113 -
 114
114 -
 115
115 -
 116
116 -
 117
117 -
 118
118 -
 119
119 -
 120
120 -
 121
121 -
 122
122 -
 123
123 -
 124
124 -
 125
125 -
 126
126 -
 127
127 -
 128
128 -
 129
129 -
130
-
131
 |
 |

F- 47
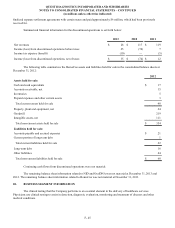
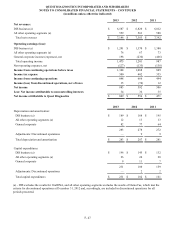
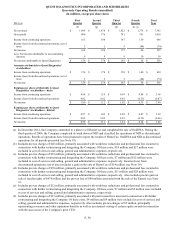
2013 2012 2011
Net revenues:
DIS business (a) $ 6,587 $ 6,820 $ 6,812
All other operating segments (a) 559 563 580
Total net revenues $ 7,146 $ 7,383 $ 7,392
Operating earnings (loss):
DIS business (a) $ 1,201 $ 1,370 $ 1,380
All other operating segments (a) 76 67 73
General corporate income (expenses), net 198 (236)(466)
Total operating income 1,475 1,201 987
Non-operating expenses, net (127)(133)(138)
Income from continuing operations before taxes 1,348 1,068 849
Income tax expense 500 402 355
Income from continuing operations 848 666 494
Income (loss) from discontinued operations, net of taxes 35 (74)12
Net income 883 592 506
Less: Net income attributable to noncontrolling interests 34 36 35
Net income attributable to Quest Diagnostics $ 849 $ 556 $ 471
2013 2012 2011
Depreciation and amortization:
DIS business (a) $ 189 $ 188 $ 195
All other operating segments (a) 12 13 13
General corporate 82 77 64
283 278 272
Adjustments: Discontinued operations — 9 9
Total depreciation and amortization $ 283 $ 287 $ 281
Capital expenditures:
DIS business (a) $ 196 $ 145 $ 132
All other operating segments (a) 26 24 20
General corporate 9 11 7
231 180 159
Adjustments: Discontinued operations — 2 2
Total capital expenditures $ 231 $ 182 $ 161
(a) - DIS excludes the results for OralDNA, and all other operating segments excludes the results of HemoCue, which met the
criteria for discontinued operations at December 31, 2012 and, accordingly, are included in discontinued operations for all
periods presented.
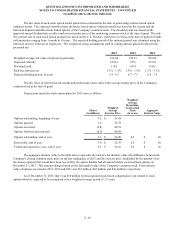
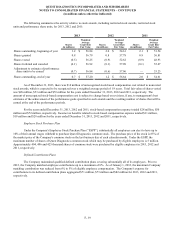
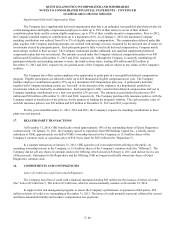
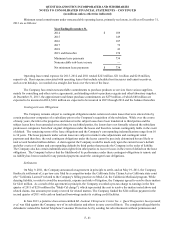
QUEST DIAGNOSTICS INCORPORATED AND SUBSIDIARIES
NOTES TO CONSOLIDATED FINANCIAL STATEMENTS – CONTINUED
(in millions unless otherwise indicated)