Quest Diagnostics 2011 Annual Report Download - page 83
Download and view the complete annual report
Please find page 83 of the 2011 Quest Diagnostics annual report below. You can navigate through the pages in the report by either clicking on the pages listed below, or by using the keyword search tool below to find specific information within the annual report.-
 1
1 -
2
-
3
-
4
-
5
-
6
-
7
-
8
-
9
-
10
-
11
-
12
-
13
-
14
-
15
-
16
-
17
-
18
-
19
-
20
-
21
-
22
-
23
-
24
-
25
-
26
-
27
-
28
-
29
-
30
-
31
-
32
-
33
-
34
-
35
-
36
-
37
-
38
-
39
-
40
-
41
-
42
-
43
-
44
-
45
-
46
-
47
-
48
-
49
-
50
-
51
-
52
-
53
-
54
-
55
-
56
-
57
-
58
-
59
-
60
-
61
-
62
-
63
-
64
-
65
-
66
-
67
-
68
-
69
-
70
-
71
-
72
-
 73
73 -
 74
74 -
 75
75 -
 76
76 -
 77
77 -
 78
78 -
 79
79 -
 80
80 -
 81
81 -
 82
82 -
 83
83 -
 84
84 -
 85
85 -
 86
86 -
 87
87 -
 88
88 -
 89
89 -
 90
90 -
 91
91 -
 92
92 -
 93
93 -
94
-
95
-
96
-
97
-
98
-
99
-
100
-
101
-
102
-
103
-
104
-
105
-
106
-
107
-
108
-
109
-
110
-
111
-
112
-
113
-
114
-
115
-
116
-
117
-
118
-
119
-
120
-
121
-
122
-
123
 |
 |

that the fair value of the investment is below carrying value; the financial condition, operating performance and
near term prospects of the investee; and the Company’s intent and ability to hold the investment for a period of
time sufficient to allow for a recovery in fair value. If the decline in fair value is deemed to be other than
temporary, the cost basis of the security is written down to fair value.
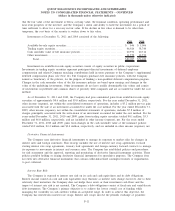
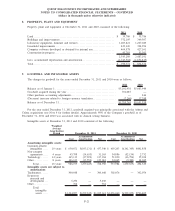
Investments at December 31, 2011 and 2010 consisted of the following:
2011 2010
Available-for-sale equity securities ............................................... $ 646 $ 5,066
Trading equity securities......................................................... 46,926 38,740
Cash surrender value of life insurance policies. . .................................. 20,936 20,314
Other investments . . ............................................................. 11,579 12,570
Total. ...................................................................... $80,087 $76,690
Investments in available-for-sale equity securities consist of equity securities in public corporations.
Investments in trading equity securities represent participant-directed investments of deferred employee
compensation and related Company matching contributions held in trusts pursuant to the Company’s supplemental
deferred compensation plans (see Note 14). The Company purchases life insurance policies, with the Company
named as beneficiary of the policies, for the purpose of funding a non-qualified deferred compensation program.
Changes in the cash surrender value of the life insurance policies are based upon earnings and changes in the
value of the underlying investments. Other investments do not have readily determinable fair values and consist
of investments in preferred and common shares of privately held companies and are accounted for under the cost
method.
As of December 31, 2011 and 2010, the Company had gross unrealized gains from available-for-sale equity
securities of approximately $0.6 million and $5.0 million, respectively. For the year ended December 31, 2011,
other income (expense), net within the consolidated statements of operations, includes a $3.2 million pre-tax gain
associated with the sale of an investment accounted for under the cost method. For the year ended December 31,
2009, other income (expense), net within the consolidated statements of operations, includes $7.8 million of
charges principally associated with the write-down of an investment accounted for under the cost method. For the
years ended December 31, 2011, 2010 and 2009, gains from trading equity securities totaled $0.1 million, $3.3
million and $6.0 million, respectively, and are included in other income (expense), net. For the years ended
December 31, 2011, 2010 and 2009, gains from changes in the cash surrender value of life insurance policies
totaled $0.2 million, $2.4 million and $2.4 million, respectively, and are included in other income (expense), net.
Derivative Financial Instruments
The Company uses derivative financial instruments to manage its exposure to market risks for changes in
interest rates and foreign currencies. This strategy includes the use of interest rate swap agreements, forward
starting interest rate swap agreements, treasury lock agreements and foreign currency forward contracts to manage
its exposure to movements in interest and currency rates. The Company has established policies and procedures
for risk assessment and the approval, reporting and monitoring of derivative financial instrument activities. These
policies prohibit holding or issuing derivative financial instruments for speculative purposes. The Company does
not enter into derivative financial instruments that contain credit-risk-related contingent features or requirements
to post collateral.
Interest Rate Risk
The Company is exposed to interest rate risk on its cash and cash equivalents and its debt obligations.
Interest income earned on cash and cash equivalents may fluctuate as interest rates change; however, due to their
relatively short maturities, the Company does not hedge these assets or their investment cash flows and the
impact of interest rate risk is not material. The Company’s debt obligations consist of fixed-rate and variable-rate
debt instruments. The Company’s primary objective is to achieve the lowest overall cost of funding while
managing the variability in cash outflows within an acceptable range. In order to achieve this objective, the
Company has entered into interest rate swaps. Interest rate swaps involve the periodic exchange of payments
F-11
QUEST DIAGNOSTICS INCORPORATED AND SUBSIDIARIES
NOTES TO CONSOLIDATED FINANCIAL STATEMENTS - CONTINUED
(dollars in thousands unless otherwise indicated)