Quest Diagnostics 2011 Annual Report Download - page 61
Download and view the complete annual report
Please find page 61 of the 2011 Quest Diagnostics annual report below. You can navigate through the pages in the report by either clicking on the pages listed below, or by using the keyword search tool below to find specific information within the annual report.-
 1
1 -
2
-
3
-
4
-
5
-
6
-
7
-
8
-
9
-
10
-
11
-
12
-
13
-
14
-
15
-
16
-
17
-
18
-
19
-
20
-
21
-
22
-
23
-
24
-
25
-
26
-
27
-
28
-
29
-
30
-
31
-
32
-
33
-
34
-
35
-
36
-
37
-
38
-
39
-
40
-
41
-
42
-
43
-
44
-
45
-
46
-
47
-
48
-
49
-
50
-
 51
51 -
 52
52 -
 53
53 -
 54
54 -
 55
55 -
 56
56 -
 57
57 -
 58
58 -
 59
59 -
 60
60 -
 61
61 -
 62
62 -
 63
63 -
 64
64 -
 65
65 -
 66
66 -
 67
67 -
 68
68 -
 69
69 -
 70
70 -
 71
71 -
72
-
73
-
74
-
75
-
76
-
77
-
78
-
79
-
80
-
81
-
82
-
83
-
84
-
85
-
86
-
87
-
88
-
89
-
90
-
91
-
92
-
93
-
94
-
95
-
96
-
97
-
98
-
99
-
100
-
101
-
102
-
103
-
104
-
105
-
106
-
107
-
108
-
109
-
110
-
111
-
112
-
113
-
114
-
115
-
116
-
117
-
118
-
119
-
120
-
121
-
122
-
123
 |
 |

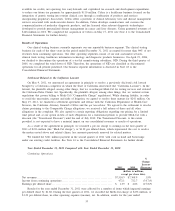
Operating Costs and Expenses
$
% Net
Revenues $
% Net
Revenues $
% Net
Revenues
2011 2010
Change:
Increase (Decrease)
(dollars in millions)
Cost of services ............................. $4,395.3 58.5% $4,317.2 58.6% $ 78.1 (0.1)%
Selling, general and administrative expenses
(SG&A) . . ................................ 1,814.3 24.2% 1,707.7 23.2% 106.6 1.0%
Amortization of intangible assets ............. 67.0 0.9% 39.2 0.5% 27.8 0.4%
Other operating expense (income), net . . . ..... 238.8 3.2% 9.3 0.1% 229.5 3.1%
Total operating costs and expenses ........... $6,515.4 86.8% $6,073.4 82.4% $442.0 4.4%
Bad debt expense (included in SG&A) . . ..... $ 279.6 3.7% $ 291.7 4.0% $ (12.1) (0.3)%
Total Operating Costs and Expenses
For the year ended December 31, 2011, the impacts of the Medi-Cal charge, severe weather, costs associated
with actions we have taken to adjust our cost structure, higher costs associated with employee compensation and
benefits, and investments we have made in our sales and service capabilities, as well the impact of the Athena
and Celera acquisitions, served to increase total operating expenses as a percent of net revenues compared to the
prior year.
Results for the year ended December 31, 2011 included the Medi-Cal charge of $236 million recorded in
connection with the California Lawsuit. In addition, results for the year ended December 31, 2011 included $52
million of pre-tax charges incurred in conjunction with further restructuring and integrating our business
consisting of $42 million of pre-tax charges, principally associated with workforce reductions, with the remainder
principally professional fees. Of these costs, $22 million and $30 million were included in cost of services and
selling, general and administrative expenses, respectively. In addition, $5.6 million of pre-tax charges, associated
with severance and other separation benefits as well as accelerated vesting of certain equity awards in connection
with the succession of our CEO, were recorded in selling, general and administrative expenses in the fourth
quarter of 2011. Selling, general and administrative expenses for the year ended December 31, 2011 also included
$16.9 million of pre-tax transaction costs, primarily related to professional fees associated with the acquisitions of
Athena and Celera.
Results for the year ended December 31, 2010 included pre-tax charges, principally associated with
workforce reductions, of $27 million ($6.4 million in cost of services and $20.6 million in selling, general and
administrative expenses). In addition, other operating expense (income), net for the year ended December 31,
2010 included a $9.6 million fourth quarter pre-tax charge associated with the settlement of employment
litigation.
Also, year-over-year comparisons of operating costs were favorably impacted by approximately $5.4 million,
associated with gains and losses on investments in our supplemental deferred compensation plans. Under our
supplemental deferred compensation plans, employee compensation deferrals, together with Company matching
contributions, are invested in a variety of investments held in trusts. Gains and losses associated with the
investments are recorded in earnings within other income (expense), net. A corresponding and offsetting
adjustment is also recorded to the deferred compensation obligation to reflect investment gains and losses earned
by the employee. Such adjustments to the deferred compensation obligation are recorded in earnings principally
within selling, general and administrative expenses and offset the amount of investment gains and losses recorded
in other income (expense), net. Results for the year ended December 31, 2011 and 2010 included an increase in
operating costs of $0.3 million and $5.7 million, respectively, representing increases in the deferred compensation
obligation to reflect investment gains earned by employees participating in our deferred compensation plans.
Cost of Services
The decrease in cost of services as a percentage of revenues for the year ended December 31, 2011
compared to the prior year primarily reflects the impact of actions we have taken to reduce our cost structure and
the acquired operations of Athena and Celera, which served to reduce the percentage. These improvements have
been partially offset by the impact of severe weather in the first quarter, a $15.8 million increase in pre-tax
charges, primarily associated with restructuring and integration activities, higher costs associated with employee
compensation and benefits, and investments we have made in service capabilities.
55