Quest Diagnostics 2011 Annual Report Download - page 49
Download and view the complete annual report
Please find page 49 of the 2011 Quest Diagnostics annual report below. You can navigate through the pages in the report by either clicking on the pages listed below, or by using the keyword search tool below to find specific information within the annual report.-
 1
1 -
2
-
3
-
4
-
5
-
6
-
7
-
8
-
9
-
10
-
11
-
12
-
13
-
14
-
15
-
16
-
17
-
18
-
19
-
20
-
21
-
22
-
23
-
24
-
25
-
26
-
27
-
28
-
29
-
30
-
31
-
32
-
33
-
34
-
35
-
36
-
37
-
38
-
 39
39 -
 40
40 -
 41
41 -
 42
42 -
 43
43 -
 44
44 -
 45
45 -
 46
46 -
 47
47 -
 48
48 -
 49
49 -
 50
50 -
 51
51 -
 52
52 -
 53
53 -
 54
54 -
 55
55 -
 56
56 -
 57
57 -
 58
58 -
 59
59 -
60
-
61
-
62
-
63
-
64
-
65
-
66
-
67
-
68
-
69
-
70
-
71
-
72
-
73
-
74
-
75
-
76
-
77
-
78
-
79
-
80
-
81
-
82
-
83
-
84
-
85
-
86
-
87
-
88
-
89
-
90
-
91
-
92
-
93
-
94
-
95
-
96
-
97
-
98
-
99
-
100
-
101
-
102
-
103
-
104
-
105
-
106
-
107
-
108
-
109
-
110
-
111
-
112
-
113
-
114
-
115
-
116
-
117
-
118
-
119
-
120
-
121
-
122
-
123
 |
 |

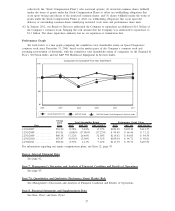
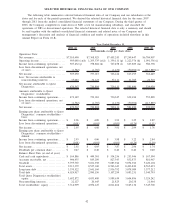
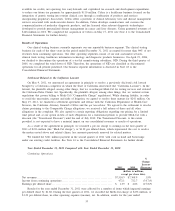
2011 (a) 2010 2009 2008 2007 (b)
Year Ended December 31,
(in thousands, except per share data)
Other Data:
Net cash provided by operating activities. . $ 895,474 (p) $1,118,047 (q) $ 997,418 (r) $1,063,049 $ 926,924
Net cash used in investing activities . ..... (1,243,435) (216,510) (195,904) (198,883) (1,759,193)
Net cash provided by (used in) financing
activities .............................. 63,546 (986,492) (521,204) (777,814) 850,223
Provision for doubtful accounts ........... 279,592 291,737 320,974 326,228 300,226
Rent expense ............................ 219,159 195,573 188,813 190,706 170,788
Capital expenditures...................... 161,556 205,400 166,928 212,681 219,101
Depreciation and amortization ............ 281,102 253,964 256,687 264,593 237,879
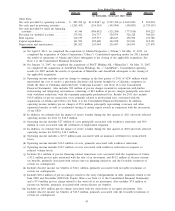
(a) On April 4, 2011, we completed the acquisition of Athena Diagnostics (“Athena”). On May 17, 2011, we
completed the acquisition of Celera Corporation (“Celera”). Consolidated operating results for 2011 include
the results of operations of Athena and Celera subsequent to the closing of the applicable acquisition. See
Note 4 to the Consolidated Financial Statements.
(b) On January 31, 2007, we completed the acquisition of POCT Holding AB, (“HemoCue”). On May 31, 2007,
we completed the acquisition of AmeriPath Group Holdings, Inc., (“AmeriPath”). Consolidated operating
results for 2007 include the results of operations of HemoCue and AmeriPath subsequent to the closing of
the applicable acquisition.
(c) Operating income includes a pre-tax charge to earnings in the first quarter of 2011 of $236 million which
represented the cost to resolve a previously disclosed civil lawsuit brought by a California competitor in
which the State of California intervened (the “California Lawsuit”) (see Note 16 to the Consolidated
Financial Statements). Also includes $52 million of pre-tax charges incurred in conjunction with further
restructuring and integrating our business, consisting of $42 million of pre-tax charges principally associated
with workforce reductions, with the remainder principally professional fees. Results for 2011 also include
$16.9 million of pre-tax transaction costs, primarily related to professional fees, associated with the
acquisitions of Athena and Celera (see Note 4 to the Consolidated Financial Statements). In addition,
operating income includes pre-tax charges of $5.6 million, principally representing severance and other
separation benefits as well as accelerated vesting of certain equity awards in connection with the succession
of our CEO.
(d) In addition, we estimate that the impact of severe weather during the first quarter of 2011 adversely affected
operating income for 2011 by $18.5 million.
(e) Operating income includes $27 million of costs principally associated with workforce reductions and $9.6
million of costs associated with the settlement of employment litigation.
(f) In addition, we estimate that the impact of severe weather during the first quarter of 2010 adversely affected
operating income for 2010 by $14.1 million.
(g) Operating income includes a $15.5 million gain associated with an insurance settlement for storm-related
losses.
(h) Operating income includes $16.2 million of costs, primarily associated with workforce reductions.
(i) Operating income includes $10.7 million of costs associated with workforce reductions in response to
reduced volume levels.
(j) Includes $3.1 million of pre-tax financing related transaction costs associated with the acquisition of Celera,
a $3.2 million pre-tax gain associated with the sale of an investment, and $18.2 million of discrete income
tax benefits, primarily associated with certain state tax planning initiatives and the favorable resolution of
certain tax contingencies.
(k) Includes discrete income tax benefits of $22.1 million, primarily associated with favorable resolutions of
certain tax contingencies.
(l) Includes $20.4 million of pre-tax charges related to the early extinguishment of debt, primarily related to the
June 2009 and November 2009 Debt Tender Offers (see Note 11 to the Consolidated Financial Statements)
and a $7.0 million pre-tax charge related to the write-off of an investment. Also includes $7.0 million of
income tax benefits, primarily associated with certain discrete tax benefits.
(m) Includes an $8.9 million pre-tax charge associated with the write-down of an equity investment. Also
includes discrete income tax benefits of $16.5 million, primarily associated with the favorable resolution of
certain tax contingencies.
43