Quest Diagnostics 2011 Annual Report Download - page 66
Download and view the complete annual report
Please find page 66 of the 2011 Quest Diagnostics annual report below. You can navigate through the pages in the report by either clicking on the pages listed below, or by using the keyword search tool below to find specific information within the annual report.-
 1
1 -
2
-
3
-
4
-
5
-
6
-
7
-
8
-
9
-
10
-
11
-
12
-
13
-
14
-
15
-
16
-
17
-
18
-
19
-
20
-
21
-
22
-
23
-
24
-
25
-
26
-
27
-
28
-
29
-
30
-
31
-
32
-
33
-
34
-
35
-
36
-
37
-
38
-
39
-
40
-
41
-
42
-
43
-
44
-
45
-
46
-
47
-
48
-
49
-
50
-
51
-
52
-
53
-
54
-
55
-
 56
56 -
 57
57 -
 58
58 -
 59
59 -
 60
60 -
 61
61 -
 62
62 -
 63
63 -
 64
64 -
 65
65 -
 66
66 -
 67
67 -
 68
68 -
 69
69 -
 70
70 -
 71
71 -
 72
72 -
 73
73 -
 74
74 -
 75
75 -
 76
76 -
77
-
78
-
79
-
80
-
81
-
82
-
83
-
84
-
85
-
86
-
87
-
88
-
89
-
90
-
91
-
92
-
93
-
94
-
95
-
96
-
97
-
98
-
99
-
100
-
101
-
102
-
103
-
104
-
105
-
106
-
107
-
108
-
109
-
110
-
111
-
112
-
113
-
114
-
115
-
116
-
117
-
118
-
119
-
120
-
121
-
122
-
123
 |
 |

Operating income for the year ended December 31, 2010 decreased as a percentage of net revenues from the
prior year, primarily as a result of the impact of lower revenues in our clinical testing business, including the
estimated impact of severe weather in the first quarter of 2010, charges associated with workforce reductions and
employment litigation, partially offset by actions taken to adjust our cost structure, reduced cost of performance-
based compensation, improved experience associated with professional liability claims and lower bad debt
expense. The estimated impact of severe weather in the first quarter of 2010, combined with charges associated
with actions we took to adjust our cost structure, and the settlement of employment litigation, adversely impacted
the year-over-year change in operating income as a percentage of net revenues by 0.7% compared to the prior
year. In addition, the year-over-year change in operating income as a percentage of net revenues was also
adversely impacted by 0.2% associated with a $15.5 million gain recorded in 2009 related to an insurance
settlement for storm-related losses.
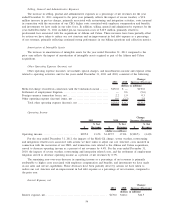
Interest Expense, net
2010 2009
Change:
Increase (Decrease)
(dollars in millions)
Interest expense, net. ................................................... $146.1 $144.1 $2.0
Interest expense, net for the year ended December 31, 2010 increased from the prior year primarily due to
higher average outstanding debt in 2010 compared to the prior year.
Other Income (Expense), net
Other income (expense), net represents miscellaneous income and expense items related to non-operating
activities, such as gains and losses associated with investments and other non-operating assets, and losses on the
early extinguishment of debt. For the years ended December 31, 2010 and 2009, other income (expense), net
consisted of the following:
2010 2009
Change:
Increase (Decrease)
(dollars in millions)
Investment gains associated with investments in our supplemental deferred
compensation plans .................................................... $ 5.7 $ 8.4 $(2.7)
Write-down of an investment ............................................. — (7.0) 7.0
Loss on early extinguishment of debt . .................................... — (20.4) 20.4
Other expense items, net ................................................. (0.4) (1.3) 0.9
Total other income (expense), net ......................................... $ 5.3 $(20.3) $25.6
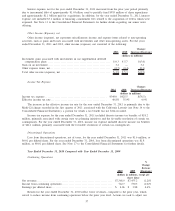
Income Tax Expense
2010 2009
Change:
Increase (Decrease)
(dollars in millions)
Income tax expense . ................................................... $425.5 $460.5 $(35.0)
Effective income tax rate ............................................... 35.9% 37.5% (1.6)%
The decrease in income tax expense for the year ended December 31, 2010 compared to the prior year was
primarily due to a reduction in income from continuing operations before income taxes of $43.6 million and a
decrease in the effective income tax rate. The effective income tax rate for the year ended December 31, 2010
decreased compared to the prior year primarily due to the favorable resolution of certain tax contingencies.
Results for the year ended December 31, 2010 included $22.1 million of income tax benefits, primarily associated
with the favorable resolution of certain tax contingencies. Results for the year ended December 31, 2009 included
$7.0 million of income tax benefits, primarily associated with certain discrete tax benefits.
Discontinued Operations
Loss from discontinued operations, net of taxes, for the year ended December 31, 2010 was $1.8 million, or
$0.01 per diluted share, compared to $1.2 million, or $0.01 per diluted share, in 2009. On April 15, 2009, the
Company entered into a final settlement agreement with the federal government regarding NID and paid $308
60