Quest Diagnostics 2011 Annual Report Download - page 43
Download and view the complete annual report
Please find page 43 of the 2011 Quest Diagnostics annual report below. You can navigate through the pages in the report by either clicking on the pages listed below, or by using the keyword search tool below to find specific information within the annual report.-
 1
1 -
2
-
3
-
4
-
5
-
6
-
7
-
8
-
9
-
10
-
11
-
12
-
13
-
14
-
15
-
16
-
17
-
18
-
19
-
20
-
21
-
22
-
23
-
24
-
25
-
26
-
27
-
28
-
29
-
30
-
31
-
32
-
 33
33 -
 34
34 -
 35
35 -
 36
36 -
 37
37 -
 38
38 -
 39
39 -
 40
40 -
 41
41 -
 42
42 -
 43
43 -
 44
44 -
 45
45 -
 46
46 -
 47
47 -
 48
48 -
 49
49 -
 50
50 -
 51
51 -
 52
52 -
 53
53 -
54
-
55
-
56
-
57
-
58
-
59
-
60
-
61
-
62
-
63
-
64
-
65
-
66
-
67
-
68
-
69
-
70
-
71
-
72
-
73
-
74
-
75
-
76
-
77
-
78
-
79
-
80
-
81
-
82
-
83
-
84
-
85
-
86
-
87
-
88
-
89
-
90
-
91
-
92
-
93
-
94
-
95
-
96
-
97
-
98
-
99
-
100
-
101
-
102
-
103
-
104
-
105
-
106
-
107
-
108
-
109
-
110
-
111
-
112
-
113
-
114
-
115
-
116
-
117
-
118
-
119
-
120
-
121
-
122
-
123
 |
 |
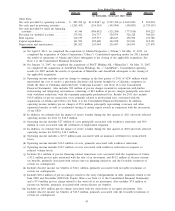
collectively the “Stock Compensation Plans”) who exercised options; (2) restricted common shares withheld
(under the terms of grants under the Stock Compensation Plans) to offset tax withholding obligations that
occur upon vesting and release of the restricted common shares; and (3) shares withheld (under the terms of
grants under the Stock Compensation Plans) to offset tax withholding obligations that occur upon the
delivery of outstanding common shares underlying restricted stock units and performance share units.
(C) In January 2012, our Board of Directors authorized the Company to repurchase an additional $1.0 billion of
the Company’s common stock, bringing the total amount that the Company was authorized to repurchase to
$1.1 billion. The share repurchase authority has no set expiration or termination date.
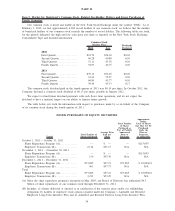
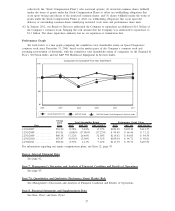
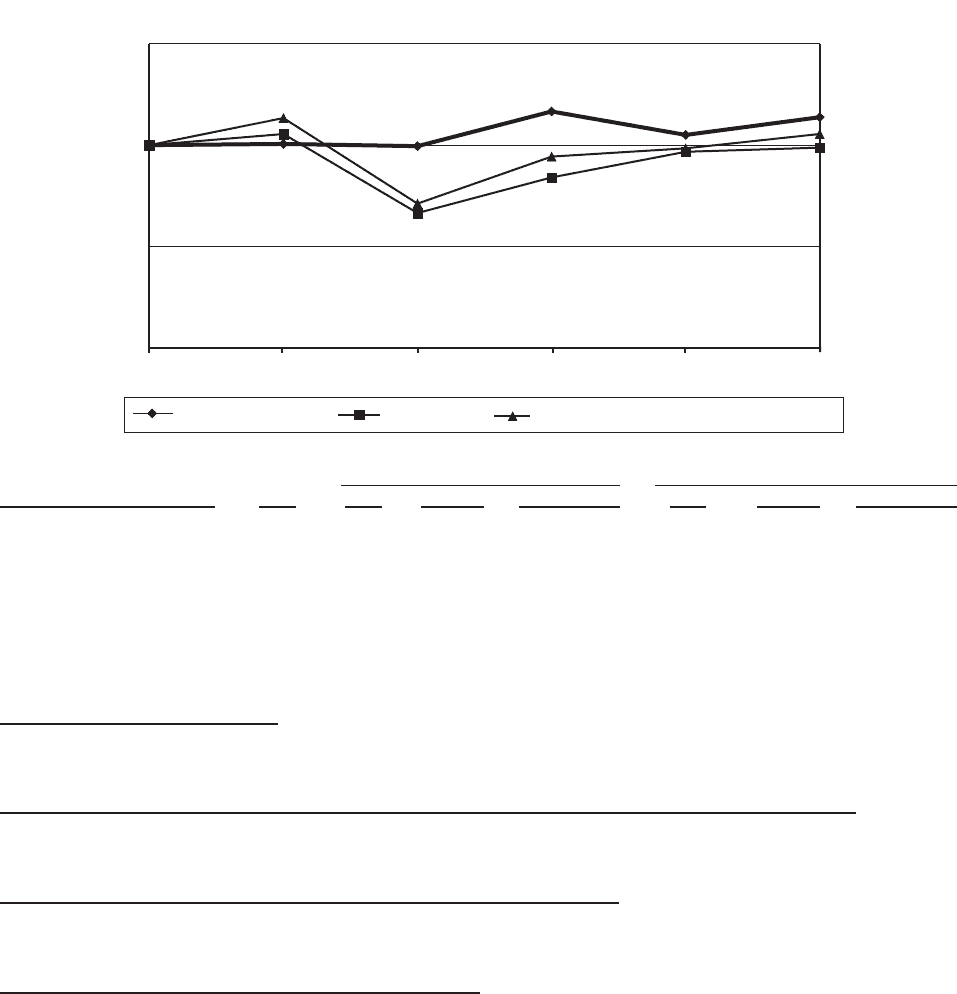
Performance Graph
Set forth below is a line graph comparing the cumulative total shareholder return on Quest Diagnostics’
common stock since December 31, 2006, based on the market price of the Company’s common stock and
assuming reinvestment of dividends, with the cumulative total shareholder return of companies on the Standard &
Poor’s 500 Stock Index and the S&P 500 Healthcare Equipment & Services Index.
Comparison of Cumulative Five Year Total Return
$0
$50
$100
$150
201120102009200820072006
S&P 500 Health Care Equipment & Services Index
S&P 500 Index
Quest Diagnostics, Inc.
Date
Closing
DGX
Price DGX S&P 500 S&P 500 H.C. DGX S&P 500 S&P 500 H.C.
Total Shareholder Return Performance Graph Values
12/31/2007 . . ............ $52.90 0.58% 5.49% 13.37% $100.58 $105.49 $113.37
12/31/2008 . . ............ $51.91 (1.08)% (37.00)% (37.27)% $ 99.49 $ 66.46 $ 71.12
12/31/2009 . . ............ $60.38 17.22% 26.46% 32.65% $116.62 $ 84.05 $ 94.34
12/31/2010 . . ............ $53.97 (9.93)% 15.06% 4.31% $105.04 $ 96.71 $ 98.41
12/30/2011 . . ............ $58.06 8.33% 2.11% 7.21% $113.79 $ 98.76 $105.50
For information regarding our equity compensation plans, see Item 12, page 39.
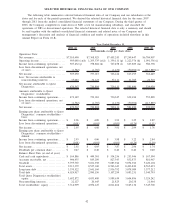
Item 6. Selected Financial Data
See page 42.
Item 7. Management’s Discussion and Analysis of Financial Condition and Results of Operations
See page 45.
Item 7A. Quantitative and Qualitative Disclosures About Market Risk
See Management’s Discussion and Analysis of Financial Condition and Results of Operations.
Item 8. Financial Statements and Supplementary Data
See Item 15(a)1 and Item 15(a)2.
37