Quest Diagnostics 2011 Annual Report Download - page 100
Download and view the complete annual report
Please find page 100 of the 2011 Quest Diagnostics annual report below. You can navigate through the pages in the report by either clicking on the pages listed below, or by using the keyword search tool below to find specific information within the annual report.-
 1
1 -
2
-
3
-
4
-
5
-
6
-
7
-
8
-
9
-
10
-
11
-
12
-
13
-
14
-
15
-
16
-
17
-
18
-
19
-
20
-
21
-
22
-
23
-
24
-
25
-
26
-
27
-
28
-
29
-
30
-
31
-
32
-
33
-
34
-
35
-
36
-
37
-
38
-
39
-
40
-
41
-
42
-
43
-
44
-
45
-
46
-
47
-
48
-
49
-
50
-
51
-
52
-
53
-
54
-
55
-
56
-
57
-
58
-
59
-
60
-
61
-
62
-
63
-
64
-
65
-
66
-
67
-
68
-
69
-
70
-
71
-
72
-
73
-
74
-
75
-
76
-
77
-
78
-
79
-
80
-
81
-
82
-
83
-
84
-
85
-
86
-
87
-
88
-
89
-
 90
90 -
 91
91 -
 92
92 -
 93
93 -
 94
94 -
 95
95 -
 96
96 -
 97
97 -
 98
98 -
 99
99 -
 100
100 -
 101
101 -
 102
102 -
 103
103 -
 104
104 -
 105
105 -
 106
106 -
 107
107 -
 108
108 -
 109
109 -
 110
110 -
111
-
112
-
113
-
114
-
115
-
116
-
117
-
118
-
119
-
120
-
121
-
122
-
123
 |
 |

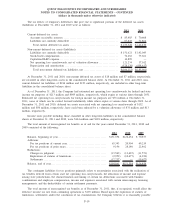
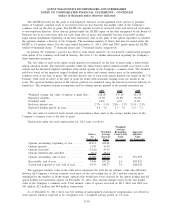
Accumulated Other Comprehensive (Loss) Income
The components of accumulated other comprehensive (loss) income for 2011, 2010 and 2009 were as
follows:
Foreign
Currency
Translation
Adjustment
Market
Value
Adjustment
Deferred
Loss
Accumulated
Other
Comprehensive
(Loss) Income
Balance, December 31, 2008 .................. $(62,994) $ (290) $(4,784) $(68,068)
Currency translation .......................... 49,586 — — 49,586
Reversal of market valuation, net of tax
expense of $190 ........................... — 290 — 290
Net deferred loss on cash flow hedges......... — — (2,553) (2,553)
Other ........................................ — (216) — (216)
Balance, December 31, 2009 .................. (13,408) (216) (7,337) (20,961)
Currency translation .......................... 27,271 — — 27,271
Market valuation, net of tax expense of $1,975 — 3,090 — 3,090
Net deferred loss on cash flow hedges......... — — 724 724
Other ........................................ — 502 — 502
Balance, December 31, 2010 .................. 13,863 3,376 (6,613) 10,626
Currency translation .......................... (12,920) — — (12,920)
Market valuation, net of tax benefit of $1,724 . — (2,696) — (2,696)
Net deferred loss on cash flow hedges......... — — (1,042) (1,042)
Other ........................................ — (2,035) — (2,035)
Balance, December 31, 2011 .................. $ 943 $(1,355) $(7,655) $ (8,067)
The reversal of market valuation for 2009 represented prior periods unrealized holding losses for investments
where the decline in fair value was deemed to be other than temporary in 2009, and the resulting loss was
recognized in the consolidated statements of operations (see Note 2). The market valuations for 2011 and 2010
represented unrealized holding gains (losses), net of taxes. The net deferred loss on cash flow hedges represents
deferred losses on the Company’s interest rate related derivative financial instruments designated as cash flow
hedges, net of amounts reclassified to interest expense (see Note 12). Foreign currency translation adjustments are
not adjusted for income taxes since they relate to indefinite investments in non-U.S. subsidiaries.
Dividends
Through the third quarter of 2011 and during each of the quarters of 2010 and 2009, the Company’s Board
of Directors declared a quarterly cash dividend of $0.10 per common share. In October 2011, the Company’s
Board of Directors declared an increase in the quarterly cash dividend from $0.10 per common share to $0.17 per
common share, which was paid on January 24, 2012, to shareholders of record on January 9, 2012.
Share Repurchases
In January 2012, the Company’s Board of Directors authorized the Company to repurchase an additional $1
billion of the Company’s common stock, increasing the total available authorization at that time to $1.1 billion.
The share repurchase authorization has no set expiration or termination date.
For the year ended December 31, 2011, the Company repurchased 17.3 million shares of its common stock
at an average price of $54.05 per share for a total of $935 million, including 15.4 million shares purchased in the
first quarter from SB Holdings Capital Inc., a wholly-owned subsidiary of GlaxoSmithKline plc. (“GSK”), at an
average price of $54.30 per share for a total of $835 million. At December 31, 2011, $65 million remained
available under the Company’s share repurchase authorization.
For the year ended December 31, 2010, the Company repurchased 14.7 million shares of its common stock
at an average price of $51.04 per share for $750 million, including 4.5 million shares purchased in the first
F-28
QUEST DIAGNOSTICS INCORPORATED AND SUBSIDIARIES
NOTES TO CONSOLIDATED FINANCIAL STATEMENTS - CONTINUED
(dollars in thousands unless otherwise indicated)