Quest Diagnostics 2011 Annual Report Download - page 75
Download and view the complete annual report
Please find page 75 of the 2011 Quest Diagnostics annual report below. You can navigate through the pages in the report by either clicking on the pages listed below, or by using the keyword search tool below to find specific information within the annual report.-
 1
1 -
2
-
3
-
4
-
5
-
6
-
7
-
8
-
9
-
10
-
11
-
12
-
13
-
14
-
15
-
16
-
17
-
18
-
19
-
20
-
21
-
22
-
23
-
24
-
25
-
26
-
27
-
28
-
29
-
30
-
31
-
32
-
33
-
34
-
35
-
36
-
37
-
38
-
39
-
40
-
41
-
42
-
43
-
44
-
45
-
46
-
47
-
48
-
49
-
50
-
51
-
52
-
53
-
54
-
55
-
56
-
57
-
58
-
59
-
60
-
61
-
62
-
63
-
64
-
 65
65 -
 66
66 -
 67
67 -
 68
68 -
 69
69 -
 70
70 -
 71
71 -
 72
72 -
 73
73 -
 74
74 -
 75
75 -
 76
76 -
 77
77 -
 78
78 -
 79
79 -
 80
80 -
 81
81 -
 82
82 -
 83
83 -
 84
84 -
 85
85 -
86
-
87
-
88
-
89
-
90
-
91
-
92
-
93
-
94
-
95
-
96
-
97
-
98
-
99
-
100
-
101
-
102
-
103
-
104
-
105
-
106
-
107
-
108
-
109
-
110
-
111
-
112
-
113
-
114
-
115
-
116
-
117
-
118
-
119
-
120
-
121
-
122
-
123
 |
 |

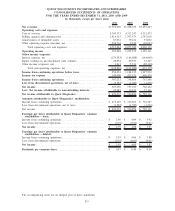
QUEST DIAGNOSTICS INCORPORATED AND SUBSIDIARIES
CONSOLIDATED STATEMENTS OF OPERATIONS
FOR THE YEARS ENDED DECEMBER 31, 2011, 2010 AND 2009
(in thousands, except per share data)
2011 2010 2009
Net revenues ......................................................... $7,510,490 $7,368,925 $7,455,243
Operating costs and expenses:
Cost of services ....................................................... 4,395,333 4,317,247 4,321,475
Selling, general and administrative ..................................... 1,814,315 1,707,673 1,747,618
Amortization of intangible assets . ...................................... 67,032 39,221 37,062
Other operating expense (income), net .................................. 238,762 9,249 (10,023)
Total operating costs and expenses................................. 6,515,442 6,073,390 6,096,132
Operating income .................................................... 995,048 1,295,535 1,359,111
Other income (expense):
Interest expense, net ................................................... (170,583) (146,088) (144,068)
Equity earnings in unconsolidated joint ventures......................... 28,954 29,557 33,207
Other income (expense), net. ........................................... 2,813 5,331 (20,318)
Total non-operating expenses, net .................................. (138,816) (111,200) (131,179)
Income from continuing operations before taxes ...................... 856,232 1,184,335 1,227,932
Income tax expense................................................... 349,000 425,531 460,474
Income from continuing operations ................................... 507,232 758,804 767,458
Loss from discontinued operations, net of taxes....................... (1,582) (1,787) (1,236)
Net income ........................................................... 505,650 757,017 766,222
Less: Net income attributable to noncontrolling interests ............. 35,083 36,123 37,111
Net income attributable to Quest Diagnostics ......................... $ 470,567 $ 720,894 $ 729,111
Amounts attributable to Quest Diagnostics’ stockholders:
Income from continuing operations ..................................... $ 472,149 $ 722,681 $ 730,347
Loss from discontinued operations, net of taxes ......................... (1,582) (1,787) (1,236)
Net income . . . ........................................................ $ 470,567 $ 720,894 $ 729,111
Earnings per share attributable to Quest Diagnostics’ common
stockholders – basic:
Income from continuing operations ..................................... $ 2.96 $ 4.09 $ 3.92
Loss from discontinued operations ...................................... (0.01) (0.01) (0.01)
Net income ........................................................... $ 2.95 $ 4.08 $ 3.91
Earnings per share attributable to Quest Diagnostics’ common
stockholders – diluted:
Income from continuing operations ..................................... $ 2.93 $ 4.06 $ 3.88
Loss from discontinued operations ...................................... (0.01) (0.01) (0.01)
Net income ........................................................... $ 2.92 $ 4.05 $ 3.87
Dividends per common share ......................................... $ 0.47 $ 0.40 $ 0.40
The accompanying notes are an integral part of these statements.
F-3